A Definitive List of the Business Benefits of Cloud Computing

When you run a Google search for the “benefits of cloud computing”, you’ll come across a number of articles with a good list of those. However, most of them don’t go into the details, which nevertheless might still suit some readers. But if you’re looking for compelling business reasons to move your company’s IT to the cloud, a peripheral understanding of what this technology can do for you certainly won’t cut it.

Now, cloud computing is not just one of those “cool” technologies that come along every couple of years and which can only benefit a particular department.?What we’re talking about here really is a paradigm shift in computing that can transform not only entire IT infrastructures but also how we run our respective organisations.

I hate to think that some people are holding back on cloud adoption just because they haven’t fully grasped what they’re missing. That is why I decided to put together this list. I wanted to produce a list that would help top management gain a deeper understanding of the benefits of the cloud.

Cloud computing is one bandwagon you really can’t afford not to jump into. Here are ten good reasons why:

1.?Zero?CAPEX and low TCO for an enterprise-class IT infrastructure

2. Improves cash flow

3. Strengthens business continuity/disaster recovery capabilities

4. Lowers the cost of analytics

5. Drives business agility

6. Ushers in anytime, anywhere collaboration

7. Enhances information, product, and service delivery

8. Keeps entire organisation in-sync

9. ?Breathes life into innovation in IT

10. Cultivates optimal environments for development and testing

Zero CAPEX and low TCO for an enterprise-class IT infrastructure

Most cloud adopters with whom I’ve talked to cite this particular reason for gaining interest in the cloud.

Of course they had to dig deeper and consider all other factors before ultimately deciding to migrate. But the first time they heard cloud services could give them access to enterprise class IT infrastructures without requiring any upfront capital investment, they realised this was something worth exploring.

A good IT infrastructure can greatly improve both your cost-effectiveness and your capability to compete with larger companies. The more reliable, fast, highly-available, and powerful it is, the better.

But then building such an infrastructure would normally require a huge capital investment for networking equipment, servers, data storage, power supply, cooling, physical space, and others, which could run up to tens or even hundreds of thousands of euros. To acquire an asset this costly, you’d have to take in debt and be burdened by the ensuing amortisation.

If you’ve got volumes of cash stashed in your vault, cost might not be a problem. But then if you really have so much savings, wouldn’t it be more prudent to use it for other sales-generating projects? An extensive marketing endeavour perhaps?

A capital expenditure of this magnitude and nature, which normally has to be approved by shareholders, can be regarded as a high financial risk. What if business doesn’t do well and you wouldn’t need all that computing power? What if the benefits expected from the IT investment are not realised??You cannot easily convert your IT infrastructure into cash.

Remember we’re talking about a depreciating asset. So even assuming you can liquidate it, you still can’t hope to sell it at its buying price. These factors are going to play in the minds of your Board of Directors when they’re asked to decide on this CAPEX.

Incidentally, these issues don’t exist in a cloud-based solution.

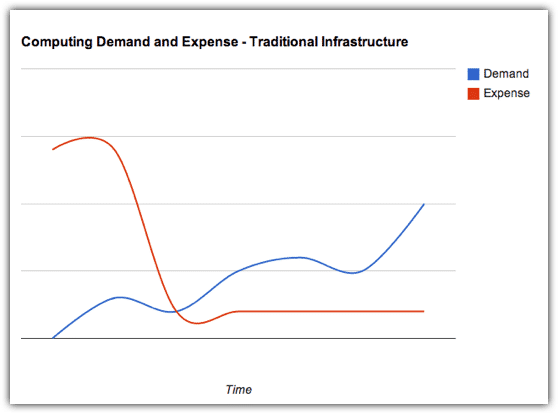
A cloud solution typically follows a pay-as-you-go utility pricing model where you get billed monthly (sometimes quarterly) just like your electricity. ?In other words, it’s an expense you’ll need to pay for?at the end of a period over which the service’s value would have already been realised. Compare that with a traditional infrastructure wherein you’ll have to spend upfront but the corresponding value will still have to be delivered gradually in the succeeding months or years.

demand expense traditional infrastructure

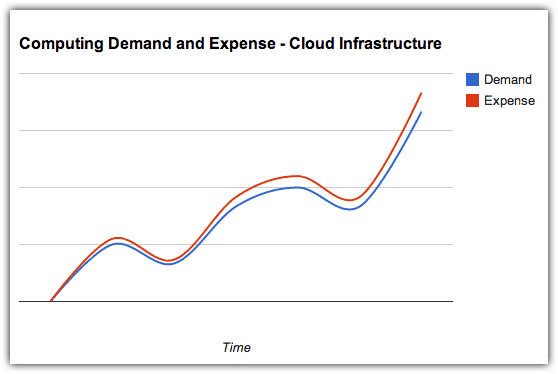
From the point of view of your CFO, what could have been a CAPEX to acquire an asset that depreciates with time (and consequently reduces your company’s net worth), becomes a flexible operating expense (OPEX).?Truly, it is an operating expense that you can increase, decrease, or even totally discontinue, depending on what the prevailing business conditions demand.

demand expense cloud infrastructure

People who think they have done the math in comparing cloud-based and traditional IT infrastructures claim that, although they see how cloud solutions transform CAPEX into OPEX, they really don’t see any significant difference in overall costs.

However, these people have only gone as far as adding up the expected monthly expenses of a cloud solution over the estimated duration of an equivalent IT infrastructure’s effective lifespan and comparing the sum with that IT infrastructure’s price tag. You won’t get a clear comparison that way.

You need to consider all factors that contribute to the infrastructure’s Total Cost of Ownership (TCO). Once you factor in the costs of electricity, floor space, storage, and IT administrators, the economical advantages of choosing a cloud solution will be more evident. Add to that the costs of downtime such as: interruptions to business operations, technical support fees, and the need to maintain expensive IT staff who spend most of their time “firefighting”, and you’ll realise just how big the savings of cloud adopters can be.

Still not convinced? Well, we’re still getting started.?On our next post, we’ll take a closer look at the additional benefits of paying under an OPEX model instead of a CAPEX model.

Contact Us

  • (+353)(0)1-443-3807 – IRL
  • (+44)(0)20-7193-9751 – UK

Check our similar posts

What is Business Intelligence?

How well do you know your customers? That is, can you actually pinpoint which among them are you most profitable with and which are making you spend more? Are you content with the accuracy of your forecasts and market predictions? Do you feel you’re spending more on legal costs and regulatory compliance than you should?

Your IT department may be handling these concerns pretty well but perhaps you’d like to know how you can further improve things.

What we’ve got is an IT solution wrapped in a fancy name called ‘Business Intelligence’ or BI. If you think that’s too strong a term, we invite you to read more below, then you be the judge.

Dashboards – Determine the health of your business at a glance

Most drivers rarely make use of their car’s dashboard. After all, you can still reach your destination by just using the steering wheel, pedals, gear stick and so on. But that’s not exactly the most efficient way to drive, right?

If you want to save on fuel, you’ll want to glance on the RPM and speedometer from time to time. You might also want to utilise the trip meter to determine which route is the shortest to a given destination. Other dashboard components like the fuel gauge, tire pressure gauge, engine temperature indicator, and volt meter can likewise provide information about your car’s health.

The same concept applies to business management. If you want to run your business intelligently, you can make use of BI dashboards. These are tools in a typical business intelligence package that will allow you to determine the health of your business via a set of smartly configured gauges and other intuitive graphical representations.

So that, literally, at a mere glance, you’ll already know whether various units in your company are working efficiently. A dashboard will also give you instant feedback of the strategies you’ve recently implemented; to let you know if things are working as planned.

If you want more information than a dashboard can provide, our BI packages also include highly customised reports.

Reports that help you decide faster

Dashboards are great for getting valuable information at a glance but they won’t tell you everything. For more details, you’ll need to view highly customised reports. Our reports are tailor made for each user. We see to it that, by default, each person gets the information he needs the most.

If you belong to the sales department, you normally won’t need a presentation of the data that is appropriate for people in accounting. That way, you don’t spend time filtering. Instead, you and your people can move on to making well-informed decisions.

Our BI systems make use of your vast collection of data to provide reports that will organise your regulatory requirements and call your attention to approaching deadlines. The same system will provide the right information for your people on the field. If your team members are equipped with smart phones and Pocket PCs, they can retrieve whatever it is they need to know to close deals, make sales, and serve clients faster than the competition.

Generating logical information from disparate sources of data scattered over an enterprise-wide organisation is no easy task. But we’ll make it look simple. That’s because we’ve got the expertise to bring it all together into a robust data warehouse and to extract them in the form of reports and dashboards through OLAP.

OLAP and Data Warehousing – Powering the generation of actionable information

Want to know how to generate reports with the highest degree of accuracy and reliability? In theory, what you need is a single repository or a data warehouse. That is, order receipts, sales invoices, as well as customer & supplier data is integrated with regulatory details, personnel data, and others. These are all specially organised for future reporting and analysis.

However, data, no matter how all-embracing, is useless until it is processed into actionable information. Through OLAP or Online Analytical Processing, you can seamlessly collect all relevant data from your vast repository to answer queries like “What is our company’s profitability for the 2nd quarter in all identified key cities for our top-of-the-line products?”.

The strength of OLAP lies in its inherent ability to perform data analysis and very complex calculations, thus enabling it to return complex queries much faster than other database technologies. It is therefore suitable for very large data sources, i.e., data warehouses.

Dashboards and reports will only give your organisation the edge if the information retrieved is reliable, fast, and accurate – exactly the kind OLAP is so good at.

Mobile BI – Step back and see the big picture anytime, anywhere

Spreadsheets are great for displaying detailed information. However, in today’s highly competitive market, retrieving information that matters the most in the shortest possible time is vital in maintaining a sizeable lead over the competition. To step back and see the big picture, you’ll need insightful tools like dashboards and automatically generated reports.

Reports can be beamed to mobile devices such as smart phones and Pocket PCs. They can also be viewed on eBook readers as well. You can also do the same tasks with spreadsheets. But imagine how you’d need to scroll over a large spreadsheet on any of these mobile devices just to know which customer in your current location has performed well over the last month.

If you really want to make quick, well-informed decisions, BI dashboards for mobile devices is the way to go. You can make use of various business objects such as drill-able charts, performance metrics, and metric trend graphs to make crucial decisions even when on you’re in the field.

Energy Cooperation Mechanisms in the EU

While the original mission of the European Union was to bring countries together to prevent future wars, this has spun out into a variety of other cooperative mechanisms its founders may never have dreamed of. Take energy for example, where the European Energy Directive puts energy cooperation mechanisms in place to help member states achieve the collective goal.

This inter-connectivity is essential because countries have different opportunities. For example, some may easily meet their renewable targets with an abundance of suitable rivers, while others may have a more regular supply of sunshine. To capitalise on these opportunities the EU created an internal energy market to make it easier for countries to work together and achieve their goals in cost-effective ways. The three major mechanisms are

  • Joint Projects
  • Statistical Transfers
  • Joint Support Schemes

Joint Projects

The simplest form is where two member states co-fund a power generation, heating or cooling scheme and share the benefits. This could be anything from a hydro project on their common border to co-developing bio-fuel technology. They do not necessarily share the benefits, but they do share the renewable energy credits that flow from it.

An EU country may also enter into a joint project with a non-EU nation, and claim a portion of the credit, provided the project generates electricity and this physically flows into the union.

Statistical Transfers

A statistical transfer occurs when one member state has an abundance of renewable energy opportunities such that it can readily meet its targets, and has surplus credits it wishes to exchange for cash. It ?sells? these through the EU accounting system to a country willing to pay for the assistance.

This aspect of the cooperative mechanism provides an incentive for member states to exceed their targets. It also controls costs, because the receiver has the opportunity to avoid more expensive capital outlays.

Joint Support Schemes

In the case of joint support schemes, two or more member countries combine efforts to encourage renewable energy / heating / cooling systems in their respective territories. This concept is not yet fully explored. It might for example include common feed-in tariffs / premiums or common certificate trading and quota systems.

Conclusion

A common thread runs through these three cooperative mechanisms and there are close interlinks. The question in ecoVaro?s mind is the extent to which the system will evolve from statistical support systems, towards full open engagement.

How Ventura Bus Lines cleaned up its Act

Melbourne?s Ventura Bus Lines grew from a single bus in 1924 to a mega 308-vehicle fleet by the start of 2014. The family-owned provider has always been community centric; when climate-change became an issue it took quick and urgent action. As a result it now stands head and shoulders above many others. Let’s take a closer look at some of its decisions that made the difference.

The Important Things to Focus On

Ethanol Buses ? Ventura is the only Australian company that uses ethanol power produced from sugar cane for experimental public transport. It compares emissions within its fleet, and knows that these produce significantly less CO2 while also creating jobs for locals.

Electric Buses ? The company has been operating electric buses since 2009. These carry 42 seated among a total 68 passengers. The ride is smooth thanks to twin battery banks kept charged by braking and forward momentum. When required, a two-litre VW engine kicks in automatically.

Ongoing Driver Training ? Ventura provides regular retraining sessions emphasising safe, environmentally-friending operations. Drivers are able to see their fuel consumption and carbon emissions online and experiment with ways to improve these.

Bus U-Turns ? The capacity to measure throughput convinced the company to abandon the principle that buses don’t do U-Turns for safety?s sake. Road re-engineering made this possible in a busy downtown street. This reduced emissions equivalent to 4,000 cars and reduced vehicle downtime for servicing.

Increased Business – These initiatives allowed Ventura Bus Lines to improve its service as customers experience it. This led to an uptake in patronage and a corresponding downturn in the number of passenger car hours. The pleasure of travelling green no doubt contributed to this.

How Measuring Made the Difference

Ventura Bus Lines is big business. Its 308 buses operate out of 5 depots, cover 31% of the metropole, and transport close to 70,000 passengers on average daily which is no minor task. The ability to track, measure and analyse carbon emissions throughout the area has earned it compliance with National Greenhouse Energy Reporting Threshold 1 legislation.

It also uses the data to re-engineer bus routes to further reduce fuel consumption, energy consumption and operating costs. It’s amazing how measuring is affecting its bottom line, and the health of the Melbourne community at large.

Contact Us

  • (+353)(0)1-443-3807 – IRL
  • (+44)(0)20-7193-9751 – UK

Ready to work with Denizon?