Still Looking For A Way To Consolidate Excel Spreadsheets?
We use Excel spreadsheets everyday. We use them to prepare budgets and reports. We even use them when drafting plans and forecasts. With this ubiquitous office application, entering data and carrying out on-the-spot computations and analysis is quick and easy. However, when it’s time to consolidate Excel data, I won’t be surprised if you wished there was an easy way.
In fact, you were probably looking for a solution before landing on this page, right?
Because budgeting, reporting, planning, and forecasting are normally done by a group of people and not just by one individual, spreadsheets bearing the necessary data can be scattered in different folders, desktops, offices, and, in the case of really large organisations, geographical locations.
How are these data brought together? Through email attachments or by sharing folders in a local area network. Each member of the working team sends out copies of their own spreadsheets to other members, who then review them, make necessary changes, then send back to the source. The files can go back and forth until everyone is satisfied.
With each sending, sharing, and edit, business critical data gets exposed to all sorts of spreadsheet risks. Copy-paste errors, omission of a negative sign, erroneous inputs, accidental deletions, and even fraudulent manipulations can take place. And because each member can end up with multiple versions of a single spreadsheet, the chance of working on the wrong version exists.
So when all the data gets consolidated and finalised, it is possible for the end product to contain significant errors. It may not happen all the time, but it certainly can happen.
But that’s not the only disadvantage of spreadsheets. The entire process of comparing cells and sheets, copy-pasting data, linking cells, writing formulas, and specifying ranges can be very tedious, not to mention time-consuming. With spreadsheets, beating deadlines is always an almost impossible exercise.
What you need is a solution that will no longer require you to consolidate Excel spreadsheets. One that is faster, more reliable, and significantly less error-prone. Denizon has a server-based solution that has all those capabilities and much more.
With a server-based solution, all your data is stored in one place. Everyone is working on the same data source, so consolidation is fast and easy. Everyone becomes synchronised and no one has to worry about working on the wrong version.
For many people within the UK, water is not really something to worry about. Surely enough of it falls out the sky throughout the year that it does feel highly unlikely that we?ll ever run out of it. There certainly does seem to be an abundance of Branded Water available in plastic bottles on our supermarket shelves.
Water, water, every where, And all the boards did shrink; Water, water, every where, Nor any drop to drink.
Despite this, Once-unthinkable water crises are becoming commonplace. If you consider that In England and Wales, we use 16 billion litres of clean drinking water every day ? that’s equivalent to 6,400 Olympic sized swimming pools.
Currently, water companies can provide slightly more than we need ? 2 billion litres are available above and beyond what we’re using. In some areas, though, such as south east England, there is no surplus and, as such, these regions are more likely to face supply restrictions in a dry year.
If we take little moment to reflect on some of the most notable water related stories over the past few years, we’ll start to get a picture of just how real the potential and the threat of water shortages can be.
Reservoirs in Chennai, India?s sixth-largest city, are nearly dry right now. Last year, residents of Cape Town, South Africa narrowly avoided their own Day Zero water shut-off.
It was only year before that, Rome rationed water to conserve scarce resources.
Climate change is likely to mean higher temperatures which may drive up the demand for water (alongside population growth) and increase evaporation from reservoirs and water courses during spring and summer.
The impact of climate change on total rainfall is uncertain, but the rain that does fall is likely to arrive in heavier bursts in winter and summer. Heavier rain tends to flow off land more quickly into rivers and out to sea, rather than recharging groundwater aquifers.
A greater chance of prolonged dry periods is also conceivable. This combined with the harsh reality that no human population can sustain itself without sufficient access to fresh water.
If present conditions continue, 2 out of 3 people on Earth will live within a water-stressed zone by 2025
What is water stress?
Water stress is a term used to describe situation when demand for water is greater than the amount of water available at a certain period in time, and also when water is of poor quality and this restricts its usage. Water stress means deterioration in both the quantity of available water and the quality of available water due to factors affecting available water.
Water stress refers to the ability, or lack thereof, to meet human and ecological demand for water. Compared to scarcity, water stress is a more inclusive and broader concept.
Water Stress considers several physical aspects related to water resources, including water scarcity, but also water quality, environmental flows, and the accessibility of water.
Supply and Demand
Major factors involved when water scarcity strikes is when a growing populations demand for water exceeds the areas ability to service that need.
Increased food production and development programs also lead to increased demand for water, which ultimately leads to water stress.
Increased need for agricultural irrigation in order to produce more crops or sustain livestock are major contributors to localised water stress.
Overconsumption
The demand for water in a given population is fairly unpredictable. Primarily, based on the fact that you can never accurately predict human behaviour and changes in climate.
If too many people are consuming more water than they need because they mistakenly believe that water is freely available and plentiful, then water stress could eventually occur.
This is also linked to perceived economic prosperity of a give region. Manufacturing demand for water can have huge impact regardless whether water is actively used within the manufacturing process or not.
Water Quality
Water quality in any given area is never static. Water stress could happen as a result of rising pollution levels having a direct impact on water quality.
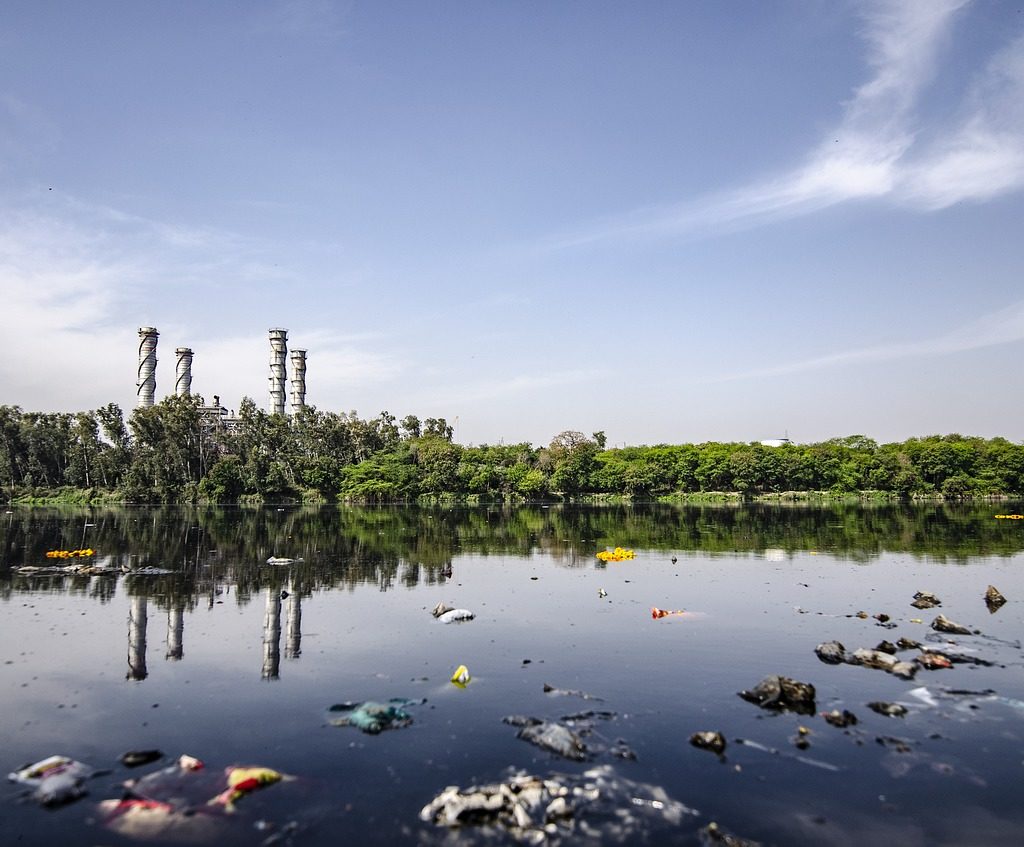
Water contamination happens when new industries either knowingly or unknowingly contaminate water with their industrial practices.
Largely, this can happen and frequently does so because these industries do not take effective control of monitoring and managing their impact on communal water supplies. Incorrectly assuming this is the responsibility of an additional third party like the regional water company.
The truth is, water quality and careful monitoring of it is all of our responsibility.
Water Scarcity
Simple increases in demand for water can in itself contribute to water scarcity. However, these are often preceded by other factors like poverty or just the natural scarcity of water in the area.
In many instances, the initial locations of towns or cities were not influenced by the close proximity of natural resources like water, but rather in pursuit of the extraction of other resources like Gold, Coal or Diamonds.
For Instance, Johannesburg, South Africa is the largest City in South Africa and is one of the 50 largest urban areas in the world. It is also located in the mineral rich Witwatersrand range of hills and is the centre of large-scale gold and diamond trade.
Johannesburg is also one of the only major cities of the world that was not built on a river or harbour. However, it does have streams that contribute to two of Southern Africas mightiest rivers – Limpopo and the Orange rivers. However, most of the springs from which many of these streams emanate are now covered in concrete!
Water Stress and Agriculture
Peter Buss, co-founder of Sentek Technology calls ground moisture a water bank and manufactures ground sensors to interrogate it. His hometown of Adelaide is in one of the driest states in Australia. This makes monitoring soil water even more critical, if agriculture is to continue. Sentek has been helping farmers deliver optimum amounts of water since 1992.
The analogy of a water bank is interesting. Agriculturists must ?bank? water for less-than-rainy days instead of squeezing the last drop. They need a stream of real-time data and utilize cloud-based storage and processing power to curate it.
Sentek?s technology can be found in remote places like Peru?s Atacamba desert and the mountains of Mongolia, where it supports sustainable floriculture, forestry, horticulture, pastures, row crops and viticulture through precise delivery of scarce water.
This relies on precision measurement using a variety of drill and drop probes with sensors fixed at 4? / 10cm increments along multiples of 12? / 30cm up to 4 times. These probe soil moisture, soil temperature and soil salinity, and are readily repositioned to other locations as crops rotate.
Peter Buss is convinced that measurement is a means to an end and only the beginning. ?Too often, growers start watering when plants don’t really need it, wasting water, energy, and labour. By accurately monitoring water can be saved until when the plant really needs it.
Peter also emphasises that crop is the ultimate sensor, and that ?we should ask the plant what it needs?.
This takes the debate a stage further. Water wise farmers should plant water-wise crops, not try to close the stable door after the horse has bolted and dry years return.
The South Australia government thinks the answer also lies in correct farm dam management. It wants farmers to build ones that allow sufficient water to bypass in order to sustain the natural environment too.
There is more to water management than squeezing the last drop. Soil moisture goes beyond measuring for profit. It is about farming sustainably using data from sensors to guide us.
Ecovaro is ahead of the curve as we explore imaginative ways to exploit the data these provide for the common good of all.
A Quarter of the World?s Population, Face High Water Stress
Data from WRI?s Aqueduct tools reveal that 17 countries? home to one-quarter of the world?s population?face ?extremely high? levels of baseline water stress, where irrigated agriculture, industries and municipalities withdraw more than 80% of their available supply on average every year.
Water stress poses serious threats to human lives, livelihoods and business stability. It’s poised to worsen unless countries act: Population growth, socioeconomic development and urbanization are increasing water demands, while climate change can make precipitation and demand more variable.
How to manage water stress
Water stress is just one dimension of water security. However, like any challenge, its outlook depends on adequate monitoring and management of environmental data.
Even countries with relatively high water stress have effectively secured their water supplies through proper management by leveraging the knowledge they have garnered by learning from the data they gathered.
3 ways to help reduce water stress
In any geography, water stress can be reduced by measures ranging from common sense to innovative technology solutions.
There are countless solutions, but here are three of the most straightforward:
1. Increase agricultural efficiency: The world needs to make every drop of water go further in its food systems. Farmers can use seeds that require less water and improve their irrigation techniques by using precision watering rather than flooding their fields.
Businesses need to increase investments to improve water productivity, while engineers develop technologies that improve efficiency in agriculture.
2. Invest in grey and green infrastructure: D Data produced by Aqueduct Alliance – shows that water stress can vary tremendously over the year. WRI and the World Bank?s researchshows that built infrastructure (like pipes and treatment plants) and green infrastructure (like wetlands and healthy watersheds) can work in tandem to tackle issues of both water supply and water quality.
3. Treat, reuse and recycle: We need to stop thinking of wastewater as waste.
Treating and reusing it creates a ?new? water source.
There are also useful resources in wastewater that can be harvested to help lower water treatment costs. For example, plants in Xiangyang, China and Washington, D.C. reuse or sell the energy- and nutrient-rich byproducts captured during wastewater treatment.
Summary
The data is undeniably clear, there are very worrying trends in water.
Businesses and other other organisations need to start taking action now and investing in better monitoring and management, we can solve water issues for the good of people, economies and the planet. We collectively cannot kick this can down the road any further, or assume that this problem will be solved by others.
It is time, for a collective sense of responsibility and for everyone to invest in future prosperity of our Planet as a collective whole. Ecological preservation should be at the forefront of all business plans because at the end of the day profit is meaningless without an environment to enjoy it in!
Threats to your data can come from external or internal sources.
There are individuals who don’t have the authorisation but are driven by malicious intentions to gain access to certain information. This may refer to individuals who already belong to your organisation (but don’t have the necessary access rights) as well as those who don’t.
There are individuals who have both the authorisation and, unfortunately, the malicious intentions over certain information.
Finally, there are individuals who have the authorisation, no malicious intentions, but have accidentally exposed the information in question to those without the proper authority.
While curbing threats 2 and 3 would require other methods, threat #1 can be countered if the right authentication and access control systems are in place.
Here’s what we can do for you:
Work with your key personnel to determine who gets access to what.
Help you decide whether a single factor or a two-factor authentication (2FA) is appropriate for your organisation and recommend which factors are most suitable. Login methods may include but are not limited to the following:
biometric devices
Kerberos tickets
mobile phones
passwords
PKI certificates
proximity cards
smart cards
tokens
Install the necessary infrastructure needed for the factors chosen. For instance, if you opt to use biometrics, then biometric scanners will be installed. We’ll make sure that the authentication terminals are situated in places where achieving optimal traffic and work flow has been taken into consideration.
Other defences we’re capable of putting up include:
The UK?s ESOS energy saving program stands for ?Energy Savings Opportunity Scheme?. Its purpose is to reduce demand – and hence fossil-based pollution at both ends of the supply chain. It currently applies to large UK companies only. However its guidelines are also valuable input to smaller firms voluntarily going greener.
The program threshold is 250 employees and / or turnover or at least ?UK50 million. This affects approximately 9,000 UK firms, with others below the threshold wondering whether the government plans to lower it. In essence, ESOS requires that qualifying businesses complete comprehensive audits of energy use and opportunities at least every fourth year.
The plan is carrot and stick. Compliant companies will probably uncover significant savings when they stop and measure. They may even unearth carbon credits they can sometime exchange for cash. Reactionary firms who try to duck the issue will feel Her Majesty?s wrath through stiff penalties. In time, they may find it harder to attract investors. If ESOS affects your company, then the wise thing could be complying by the first deadline of 5 December 2015.
To do so, you must conduct an energy audit and report it to the UK Environment Agency. This comprises
Measuring total energy use across processes, transport and facilities
Pie charting 90% of this to identify areas that are energy intensive
Singling out cost-effective energy-saving projects in high use areas
Submitting your report to the Environment Agency ahead of the deadline
ecoVaro recommends affected companies do not leave this to the last minute. While having ISO 50001 may exempt some from ESOS, the regulations are far from straightforward and it will take months to reach complete clarification. We would like to suggest a more balanced approach.
ESOS is a wonderful incentive to save energy costs while contributing to a better future for the kids. The Energy Savings Opportunity Scheme is precisely that. The cost of energy has crept up on us to the extent that we have to do something, government or no government.
Measuring energy consumption is as simple as installing meters at critical points in the flow, and you probably have many of them anyway. Once you have your data you no longer have to crunch the numbers. ecoVaro can do this for you and return the result in the form of handy graphs and spreadsheets.