To any company executive or business owner, the mere possibility of fraud can be enough to send alarm bells ringing – for good reason. In a prolonged recession, the last thing investors would want to discover is a huge, gaping hole where supposedly a neat profit should have been. Also to find out that such loss was brought about by deliberately falsified accounting and poor spreadsheet controls only makes the situation even more regrettable.
Why?
Because these losses would not have occurred had there been a stronger risk management program in place and more stringent quality control on critical data to begin with.
But given the nature of a spreadsheet system i.e. its sheer flexibility and easy accessibility, plus the fact that they were never intended to be enterprise-level tools, there are no hard and fast rules for auditing spreadsheets. Also because of the lack of internal controls for end user computing (EUC) applications, in this case spreadsheets, you can’t expect these systems to yield consistently accurate results.
In fact, most managers assume that major spreadsheet errors should result in figures that are blatantly out of touch with how things stand in the real world, making these errors easily detectable.
Well they assumed wrong. You’ll find cases where the losses ran to millions of dollars without anyone being the wiser.
In instances of fraud, the problem becomes more complicated as these errors are deliberately hidden and cleverly disguised, perhaps one erroneous cell at a time. Even if these cover-ups started out with smaller figures that may have had negligible impact on a company?s operation, the cumulative costs of these ?insignificant? errors multiply exponentially as the spreadsheets are reused and utilised as bases for other related reports.
While there is no generally accepted definition of the term ?spreadsheet fraud?, its quite easy to identify one when a case crops up. Fraud arising from spreadsheets are typically characterised by:
Fallacious inputs – correct figures are deliberately replaced with false values.
Erroneous outputs owing to data alteration – hyperlinks are linking to the wrong spreadsheets or cells; use of macros or special lines of code which are understandable only to the person who developed the code.
Concealment of critical information – can be done with easy ?tweaks? such as hidden rows and columns, using the same colour for both the font and the background, or hard coding additional values into a cell.
There is nothing really highly-sophisticated or technical in any of these methodologies. But without internal spreadsheet controls in place, it would take a discerning eye and a thorough review to catch the inconsistencies contained in a spreadsheet fraught with errors. Also, if these errors are knowingly placed there, the chances of finding them are close to nil.
Learn more about our server application solutions and discover a better way to protect your company from spreadsheet fraud.
For many people within the UK, water is not really something to worry about. Surely enough of it falls out the sky throughout the year that it does feel highly unlikely that we?ll ever run out of it. There certainly does seem to be an abundance of Branded Water available in plastic bottles on our supermarket shelves.
Water, water, every where, And all the boards did shrink; Water, water, every where, Nor any drop to drink.
Despite this, Once-unthinkable water crises are becoming commonplace. If you consider that In England and Wales, we use 16 billion litres of clean drinking water every day ? that’s equivalent to 6,400 Olympic sized swimming pools.
Currently, water companies can provide slightly more than we need ? 2 billion litres are available above and beyond what we’re using. In some areas, though, such as south east England, there is no surplus and, as such, these regions are more likely to face supply restrictions in a dry year.
If we take little moment to reflect on some of the most notable water related stories over the past few years, we’ll start to get a picture of just how real the potential and the threat of water shortages can be.
Reservoirs in Chennai, India?s sixth-largest city, are nearly dry right now. Last year, residents of Cape Town, South Africa narrowly avoided their own Day Zero water shut-off.
It was only year before that, Rome rationed water to conserve scarce resources.
Climate change is likely to mean higher temperatures which may drive up the demand for water (alongside population growth) and increase evaporation from reservoirs and water courses during spring and summer.
The impact of climate change on total rainfall is uncertain, but the rain that does fall is likely to arrive in heavier bursts in winter and summer. Heavier rain tends to flow off land more quickly into rivers and out to sea, rather than recharging groundwater aquifers.
A greater chance of prolonged dry periods is also conceivable. This combined with the harsh reality that no human population can sustain itself without sufficient access to fresh water.
If present conditions continue, 2 out of 3 people on Earth will live within a water-stressed zone by 2025
What is water stress?
Water stress is a term used to describe situation when demand for water is greater than the amount of water available at a certain period in time, and also when water is of poor quality and this restricts its usage. Water stress means deterioration in both the quantity of available water and the quality of available water due to factors affecting available water.
Water stress refers to the ability, or lack thereof, to meet human and ecological demand for water. Compared to scarcity, water stress is a more inclusive and broader concept.
Water Stress considers several physical aspects related to water resources, including water scarcity, but also water quality, environmental flows, and the accessibility of water.
Supply and Demand
Major factors involved when water scarcity strikes is when a growing populations demand for water exceeds the areas ability to service that need.
Increased food production and development programs also lead to increased demand for water, which ultimately leads to water stress.
Increased need for agricultural irrigation in order to produce more crops or sustain livestock are major contributors to localised water stress.
Overconsumption
The demand for water in a given population is fairly unpredictable. Primarily, based on the fact that you can never accurately predict human behaviour and changes in climate.
If too many people are consuming more water than they need because they mistakenly believe that water is freely available and plentiful, then water stress could eventually occur.
This is also linked to perceived economic prosperity of a give region. Manufacturing demand for water can have huge impact regardless whether water is actively used within the manufacturing process or not.
Water Quality
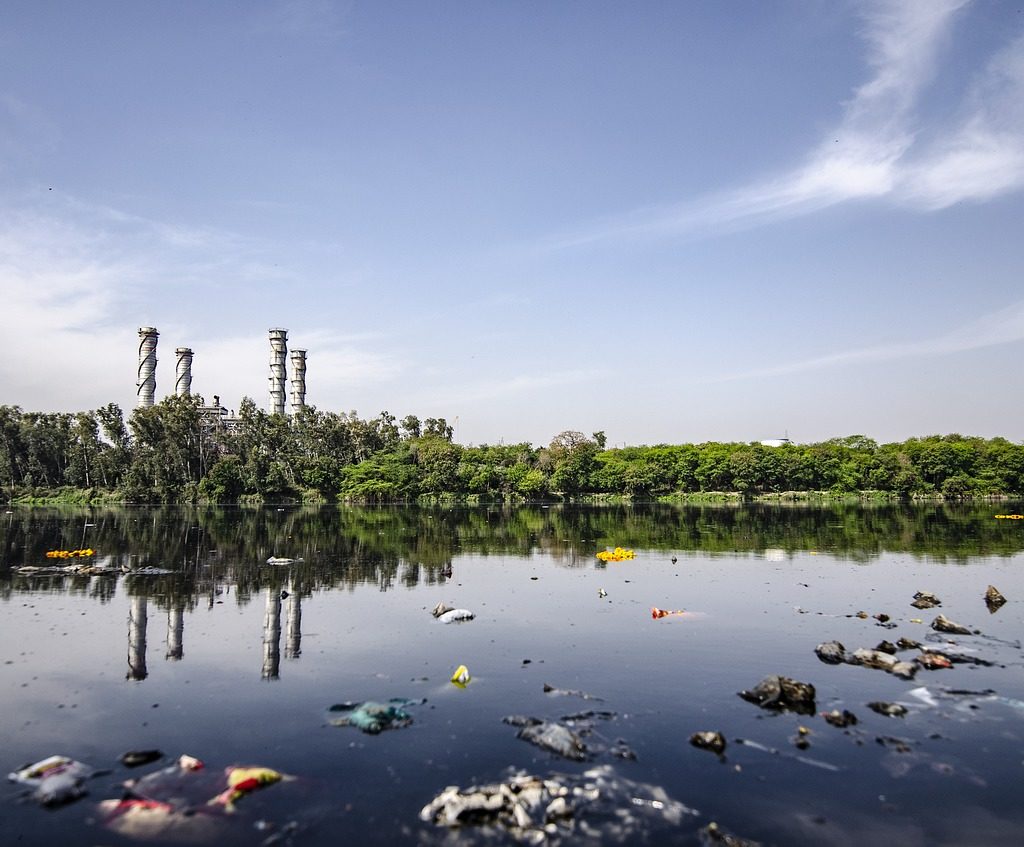
Water quality in any given area is never static. Water stress could happen as a result of rising pollution levels having a direct impact on water quality.
Water contamination happens when new industries either knowingly or unknowingly contaminate water with their industrial practices.
Largely, this can happen and frequently does so because these industries do not take effective control of monitoring and managing their impact on communal water supplies. Incorrectly assuming this is the responsibility of an additional third party like the regional water company.
The truth is, water quality and careful monitoring of it is all of our responsibility.
Water Scarcity
Simple increases in demand for water can in itself contribute to water scarcity. However, these are often preceded by other factors like poverty or just the natural scarcity of water in the area.
In many instances, the initial locations of towns or cities were not influenced by the close proximity of natural resources like water, but rather in pursuit of the extraction of other resources like Gold, Coal or Diamonds.
For Instance, Johannesburg, South Africa is the largest City in South Africa and is one of the 50 largest urban areas in the world. It is also located in the mineral rich Witwatersrand range of hills and is the centre of large-scale gold and diamond trade.
Johannesburg is also one of the only major cities of the world that was not built on a river or harbour. However, it does have streams that contribute to two of Southern Africas mightiest rivers – Limpopo and the Orange rivers. However, most of the springs from which many of these streams emanate are now covered in concrete!
Water Stress and Agriculture
Peter Buss, co-founder of Sentek Technology calls ground moisture a water bank and manufactures ground sensors to interrogate it. His hometown of Adelaide is in one of the driest states in Australia. This makes monitoring soil water even more critical, if agriculture is to continue. Sentek has been helping farmers deliver optimum amounts of water since 1992.
The analogy of a water bank is interesting. Agriculturists must ?bank? water for less-than-rainy days instead of squeezing the last drop. They need a stream of real-time data and utilize cloud-based storage and processing power to curate it.
Sentek?s technology can be found in remote places like Peru?s Atacamba desert and the mountains of Mongolia, where it supports sustainable floriculture, forestry, horticulture, pastures, row crops and viticulture through precise delivery of scarce water.
This relies on precision measurement using a variety of drill and drop probes with sensors fixed at 4? / 10cm increments along multiples of 12? / 30cm up to 4 times. These probe soil moisture, soil temperature and soil salinity, and are readily repositioned to other locations as crops rotate.
Peter Buss is convinced that measurement is a means to an end and only the beginning. ?Too often, growers start watering when plants don’t really need it, wasting water, energy, and labour. By accurately monitoring water can be saved until when the plant really needs it.
Peter also emphasises that crop is the ultimate sensor, and that ?we should ask the plant what it needs?.
This takes the debate a stage further. Water wise farmers should plant water-wise crops, not try to close the stable door after the horse has bolted and dry years return.
The South Australia government thinks the answer also lies in correct farm dam management. It wants farmers to build ones that allow sufficient water to bypass in order to sustain the natural environment too.
There is more to water management than squeezing the last drop. Soil moisture goes beyond measuring for profit. It is about farming sustainably using data from sensors to guide us.
Ecovaro is ahead of the curve as we explore imaginative ways to exploit the data these provide for the common good of all.
A Quarter of the World?s Population, Face High Water Stress
Data from WRI?s Aqueduct tools reveal that 17 countries? home to one-quarter of the world?s population?face ?extremely high? levels of baseline water stress, where irrigated agriculture, industries and municipalities withdraw more than 80% of their available supply on average every year.
Water stress poses serious threats to human lives, livelihoods and business stability. It’s poised to worsen unless countries act: Population growth, socioeconomic development and urbanization are increasing water demands, while climate change can make precipitation and demand more variable.
How to manage water stress
Water stress is just one dimension of water security. However, like any challenge, its outlook depends on adequate monitoring and management of environmental data.
Even countries with relatively high water stress have effectively secured their water supplies through proper management by leveraging the knowledge they have garnered by learning from the data they gathered.
3 ways to help reduce water stress
In any geography, water stress can be reduced by measures ranging from common sense to innovative technology solutions.
There are countless solutions, but here are three of the most straightforward:
1. Increase agricultural efficiency: The world needs to make every drop of water go further in its food systems. Farmers can use seeds that require less water and improve their irrigation techniques by using precision watering rather than flooding their fields.
Businesses need to increase investments to improve water productivity, while engineers develop technologies that improve efficiency in agriculture.
2. Invest in grey and green infrastructure: D Data produced by Aqueduct Alliance – shows that water stress can vary tremendously over the year. WRI and the World Bank?s researchshows that built infrastructure (like pipes and treatment plants) and green infrastructure (like wetlands and healthy watersheds) can work in tandem to tackle issues of both water supply and water quality.
3. Treat, reuse and recycle: We need to stop thinking of wastewater as waste.
Treating and reusing it creates a ?new? water source.
There are also useful resources in wastewater that can be harvested to help lower water treatment costs. For example, plants in Xiangyang, China and Washington, D.C. reuse or sell the energy- and nutrient-rich byproducts captured during wastewater treatment.
Summary
The data is undeniably clear, there are very worrying trends in water.
Businesses and other other organisations need to start taking action now and investing in better monitoring and management, we can solve water issues for the good of people, economies and the planet. We collectively cannot kick this can down the road any further, or assume that this problem will be solved by others.
It is time, for a collective sense of responsibility and for everyone to invest in future prosperity of our Planet as a collective whole. Ecological preservation should be at the forefront of all business plans because at the end of the day profit is meaningless without an environment to enjoy it in!
Total Quality Management (TQM) is another business management approach that focuses on the involvement of all members of the organisation to participate in improving processes, products, services, and the culture in which they work in. It is important that every team member realises how each individual and each activity affects, and in turn is affected by, others.
With the use of combined quality and management tools, TQM also aims to reduce losses brought about by wasteful practices, a common concern in most companies. Using the TQM strategy, business would also be able to identify the cause of a defect, thereby preventing it from entering the final product.
Deming’s 14 Points
At the core of the Total Quality Management concept and implementation is Deming’s 14 points, a set of guidelines on quality as conceptualised by W Edwards Deming, one of the pioneers of quality. Deming’s 14 points are as follows:
Create constancy of purpose for improving products and services.
Adopt the new philosophy.
Cease dependence on inspection to achieve quality.
End the practice of awarding business on price alone; instead, minimise total cost by working with a single supplier.
Improve constantly and forever every process for planning, production and service.
Institute training on the job.
Adopt and institute leadership.
Drive out fear.
Break down barriers between staff areas.
Eliminate slogans, exhortations and targets for the workforce.
Eliminate numerical quotas for the workforce and numerical goals for management.
Remove barriers that rob people of pride of workmanship, and eliminate the annual rating or merit system.
Institute a vigorous program of education and self-improvement for everyone.
Put everybody in the company to work accomplishing the transformation.
But if you were to reduce to bare bones the TQM philosophy from Deming’s 14 points, it would all come down to two simple goals:
To make things right the first time; and
To work for continuous improvement.
As with all other quality management process, the end goal is to be able to offer products and services that meet and even exceed customer’s expectations.
Find out more about our Quality Assurance services in the following pages:
In 2012 the European Union passed its EU Energy Efficiency Directive (EED) into law. This aims to reduce overall energy consumption by 20% by 2020. It placed an obligation on member states to pass back-to-back local legislation by June 2014.
EED Guidelines
The EED provides specific guidelines it expects member nations to address. The list is long and here are a few excerpts from it:
Large companies must use energy audits to identify ways to cut their energy consumption
Small and medium companies must be incentivised to voluntarily take similar steps
Public sector bodies must purchase energy-efficient buildings, products and services
Private energy-consumers must be empowered with information to help manage demand
Energy distributors / resellers must cut their own consumption by 1.5% annually
Legislators are free to substitute green building technology e.g. through better insulation
Every year, European governments must audit 3% of the buildings they own
Definition of Energy Audit
An energy-consumption audit is a question of measuring demand throughout a supply grid, with particular attention to individual modules and high demand equipment. While this could be an exercise repeated every four years to satisfy ESOS, it makes more sense to incorporate it into the monthly energy billing cycle.
Because energy use is not consistent but varies according to production cycle, this can produce reams of printouts designed to frustrate busy managers. ecoVaro offers an inexpensive, cloud-based analytic service that effortlessly accepts client data and returns it in the form of high-level graphic summaries.
Potential ESOS Beneficiaries
As many as 9,000 UK companies are obligated to do energy audits because they employ more than 250 employees, have a balance sheet total over ?36.5m or an annual turnover in excess of ?42m. Any smaller enterprise that finds energy a significant input cost, should also consider enlisting Ecovaro to help it to:
Obtain a better understanding of the energy side of their business
Achieve energy savings and share in a estimated ?3bn bonanza to 2030
Reduce carbon emissions to help meet their CRC commitments
More About ecoVaro
We offer web-based energy management software that helps you measure and manage energy costs. This strips data from your meters and generates personalised reports on a dashboard you control. This information helps you accurately zoom in on worthwhile opportunities. With Ecovaro on your side, ESOS truly becomes an Energy Saving OPPORTUNITY Scheme.