There may have been times when you actually spent on the right IT system but didn’t have adequate expertise to instil the appropriate learning curve for your end users. Oftentimes, users find a new system too complicated and end up spending more hours familiarising with intricate processes than is economically acceptable.
There are also applications that are just too inherently sophisticated that, even after the period of familiarisation, a lot of time is still spent managing or even just using them. Therefore, at the end of each day, your administrators and users aren’t able to complete much business-related tasks.
The first scenario can be solved by providing adequate training and tech support. The second might require enhancements or, in extreme cases, an overhaul of the technology itself.
For instance, consider what happens right after the conclusion of a merger and acquisition (M&A). CIOs from both sides and their teams will have to work hard to bring disparate technologies together. The objective is to hide these complexities and allow customers, managers, suppliers and other stakeholders to get hold of relevant information with as little disruption as possible.
One solution would be to implement Data Warehousing, OLAP, and Business Intelligence (BI) technologies to handle extremely massive data and present them into usable information.
These are just some of the many scenarios where you’ll need our expertise to eliminate the complexities that can slow your operations down.
Here are some of the solutions and benefits we can offer when we start working with you:
Consolidated hardware, storage, applications, databases, and processes for easier and more efficient management at a fraction of the usual cost.
BI (Business Intelligence) technologies for improved quality of service and for your people, particularly your managers, to focus on making decisions and not just filtering out data.
Training, workshops, and discussions that provide a clear presentation of the inter-dependencies among applications, infrastructure, and the business processes they support.
Increased automation of various processes resulting in shorter administration time. This will free your administrators and allow them to shift their attention to innovative endeavours.
Find out how we can increase your efficiency even more:
Because information technology is now integrated in most businesses, a business continuity plan (BCP) cannot be complete without a corresponding disaster recovery plan (DRP). While a BCP encompasses everything needed – personnel, facilities, communications, processes and IT infrastructure – for a continuous delivery of products and services, a DRP is more focused on the IT aspects of the plan.
If you’re still not sure how big an impact loss of data can have, it’s time you pondered on the survival statistics of companies that incurred data losses after getting hit by a major disaster: 46% never recovered and 51% eventually folded after only two years.
Realising how damaging data loss can be to their entire business, most large enterprises allocate no less than 2% of their IT budget to disaster recovery planning. Those with more sensitive data apportion twice more than that.
A sound disaster recovery plan is hinged on the principles of business continuity. As such, our DRP (Disaster Recovery Plan) blueprints are aimed at getting your IT system up and running in no time. Here’s what we can do for you:
Since the number one turn-off against BCPs and DRPs are their price tags, we’ll make a thorough and realistic assessment of possible risks to determine what specific methods need to be applied to your organisation and make sure you don’t spend more than you should.
Provide an option for virtualisation to enjoy substantial savings on disaster recovery costs.
Provide various backup options and suggest schedules and practices most suitable for your daily transactions.
Offer data replication to help you achieve business continuity with the shortest allowable downtime.
Refer to your overall BCP to determine your organisation’s critical functions, services, and products as well as their respective priority rankings to know what corresponding IT processes need to be in place first.
Implement IT Security to your system to reduce the risks associated with malware and hackers.
Introduce best practices to make future disaster recovery efforts as seamless as possible.
A well planned strategy is the necessary bridge between brilliant leadership and excellent execution. Without it, your entire organisation cannot hope to respond quickly and effectively to challenges and changes within the landscape on which it operates.
Strategic planning involves identifying objectives, understanding what resources are needed to attain them, and then allocating the resources to the appropriate units to ensure they are used optimally towards the achievement of desired objectives. Among the end results which can be reflected by your team members are:
Deeper understanding of the competitive environment;
Snappy execution of plans;
Faster, more aligned actions; and
More intelligent and apt responses against strategic moves of the competition.
We understand the need to institute strategic management in such a way that your organisation can easily adapt to unforeseen developments. As such, all our solutions are formulated to make your organisation not only well-guided but also as dynamic as possible.
Strategy Formulation
Before you can proceed to map out any strategy for your company, you’ll have to study your company’s current environment. This will help you determine what courses of action should be taken to be able to navigate through such environment on your way to the end goal.
If you’re not a full time strategist, such a task can either be very daunting or deceivingly easy… the former can prevent your team from getting started, while the latter can lead your team astray.
Ideally, strategy formulation should be carried out as quickly and as efficiently as possible so you can move on to implementation before the competition can react. Our methods can enable your leaders to hit the ground running each time they set out on a strategic plan.
How?
We can assist in accurately applying strategic tools like SWOT and Gap analysis, then help integrate the results into an effective strategic plan.
We’ll train your team how to carry out effective research techniques so that the information they gather will really be what we need. This is because the tools mentioned earlier can only work effectively if the inputs were picked intelligently. Of course, if you want the entire process expedited, we can also conduct the research ourselves.
We’ll establish best practices for top-down, bottom-up, and collaborative strategic management processes. We’ll even show you how to organise and hold meetings where team members are constantly engaged and in-sync, so action plans can be developed and relayed fast.
We’ll see to it that strategies for all functional departments (such as IT management, supply-chain, HR, marketing, and legal) are in line with your business strategies, which should in, turn be aligned with your overall corporate strategy.
Strategy Evaluation
Your strategies have to be periodically assessed if you want to determine whether they are attuned to variations affecting your organisation. These changes may include new technologies, emerging competitors, new opportunities, as well as unexpected developments in the economic environment and political climate.
While no time limit is imposed for the build-up of resources vital to the attainment of a specific objective, the window of opportunity can shut on you before you can start amassing such resources. Given this possibility, it is important for your strategies to undergo evaluation processes that will determine whether you should pursue them or not.
Using only the most reliable evaluation techniques, we’ll help you establish whether:
Your strategies will place your company in a position that will give it competitive advantage or will erode whatever advantage the competition already has;
Your strategies are consistent with the landscape on which your company currently traverses;
They are realistic enough in relation to the resources you have on hand;
The associated risks have all been identified and the appropriate control measures have already been put in place;
The time frames for their full realisation are both realistic and acceptable.
Portfolio Management
In today’s highly competitive market, many of the more successful enterprises are driven by project-based systems.
Now, there’s always a tendency for project managers to become overenthusiastic and to come up with a number of projects that can’t be sustained by available resources. If your project-based company frequently runs out of resources, then either you just have too many projects running or too much is being allocated to a select few.
In both instances, the problem does not necessarily lie on the individual project managers themselves. Rather, what is needed is the ability to have full control over existing projects and investments.
Your leadership should be able to rank projects in terms of their impact to your organisation’s growth, positioning, and profitability. This will give you sufficient information when deciding which projects to pursue, prioritise, or shut down. These are the benefits you’ll gain from our services:
A vivid presentation of the big picture. Only when you can step back from all the detail and see the interplay of investments and resources will you be able to make wise decisions regarding how and where to position them.
The ability to distinguish between projects with the highest potentials and those that are outdated.
Access to expertise that will help you distribute your present IT infrastructure, human resources, financial resources, and facilities across running projects to obtain the biggest benefits for all stakeholders.
For many people within the UK, water is not really something to worry about. Surely enough of it falls out the sky throughout the year that it does feel highly unlikely that we?ll ever run out of it. There certainly does seem to be an abundance of Branded Water available in plastic bottles on our supermarket shelves.
Water, water, every where, And all the boards did shrink; Water, water, every where, Nor any drop to drink.
Despite this, Once-unthinkable water crises are becoming commonplace. If you consider that In England and Wales, we use 16 billion litres of clean drinking water every day ? that’s equivalent to 6,400 Olympic sized swimming pools.
Currently, water companies can provide slightly more than we need ? 2 billion litres are available above and beyond what we’re using. In some areas, though, such as south east England, there is no surplus and, as such, these regions are more likely to face supply restrictions in a dry year.
If we take little moment to reflect on some of the most notable water related stories over the past few years, we’ll start to get a picture of just how real the potential and the threat of water shortages can be.
Reservoirs in Chennai, India?s sixth-largest city, are nearly dry right now. Last year, residents of Cape Town, South Africa narrowly avoided their own Day Zero water shut-off.
It was only year before that, Rome rationed water to conserve scarce resources.
Climate change is likely to mean higher temperatures which may drive up the demand for water (alongside population growth) and increase evaporation from reservoirs and water courses during spring and summer.
The impact of climate change on total rainfall is uncertain, but the rain that does fall is likely to arrive in heavier bursts in winter and summer. Heavier rain tends to flow off land more quickly into rivers and out to sea, rather than recharging groundwater aquifers.
A greater chance of prolonged dry periods is also conceivable. This combined with the harsh reality that no human population can sustain itself without sufficient access to fresh water.
If present conditions continue, 2 out of 3 people on Earth will live within a water-stressed zone by 2025
What is water stress?
Water stress is a term used to describe situation when demand for water is greater than the amount of water available at a certain period in time, and also when water is of poor quality and this restricts its usage. Water stress means deterioration in both the quantity of available water and the quality of available water due to factors affecting available water.
Water stress refers to the ability, or lack thereof, to meet human and ecological demand for water. Compared to scarcity, water stress is a more inclusive and broader concept.
Water Stress considers several physical aspects related to water resources, including water scarcity, but also water quality, environmental flows, and the accessibility of water.
Supply and Demand
Major factors involved when water scarcity strikes is when a growing populations demand for water exceeds the areas ability to service that need.
Increased food production and development programs also lead to increased demand for water, which ultimately leads to water stress.
Increased need for agricultural irrigation in order to produce more crops or sustain livestock are major contributors to localised water stress.
Overconsumption
The demand for water in a given population is fairly unpredictable. Primarily, based on the fact that you can never accurately predict human behaviour and changes in climate.
If too many people are consuming more water than they need because they mistakenly believe that water is freely available and plentiful, then water stress could eventually occur.
This is also linked to perceived economic prosperity of a give region. Manufacturing demand for water can have huge impact regardless whether water is actively used within the manufacturing process or not.
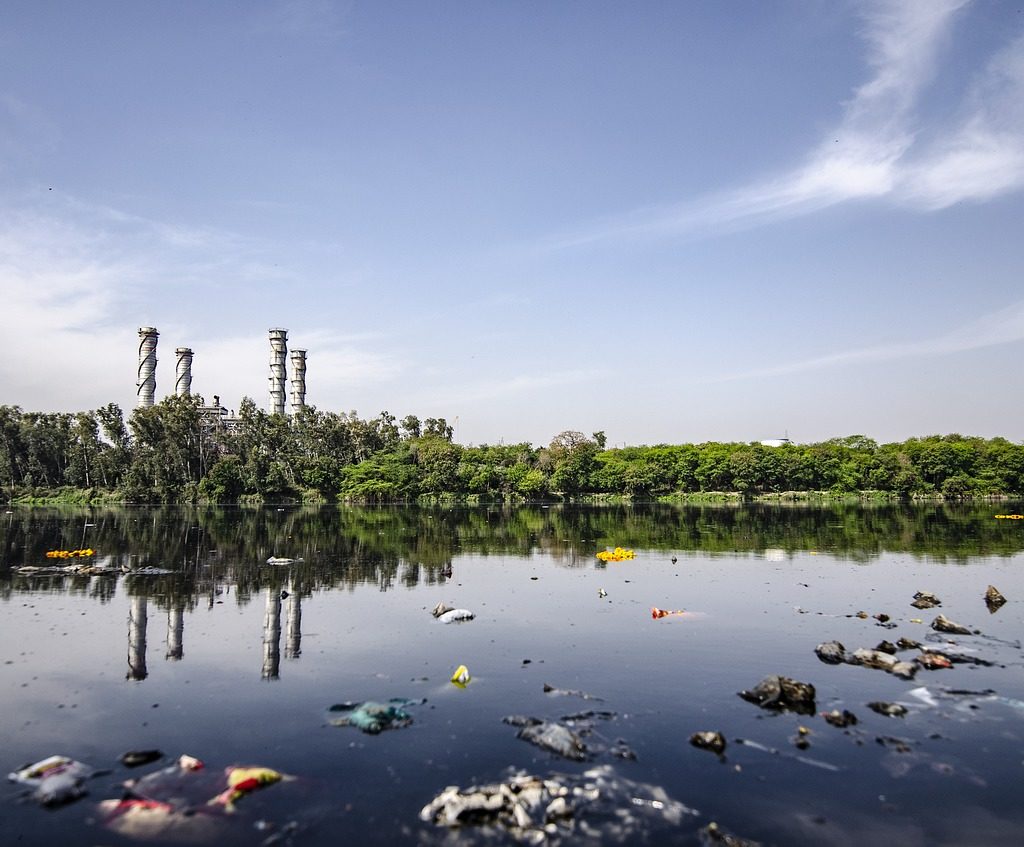
Water Quality
Water quality in any given area is never static. Water stress could happen as a result of rising pollution levels having a direct impact on water quality.
Water contamination happens when new industries either knowingly or unknowingly contaminate water with their industrial practices.
Largely, this can happen and frequently does so because these industries do not take effective control of monitoring and managing their impact on communal water supplies. Incorrectly assuming this is the responsibility of an additional third party like the regional water company.
The truth is, water quality and careful monitoring of it is all of our responsibility.
Water Scarcity
Simple increases in demand for water can in itself contribute to water scarcity. However, these are often preceded by other factors like poverty or just the natural scarcity of water in the area.
In many instances, the initial locations of towns or cities were not influenced by the close proximity of natural resources like water, but rather in pursuit of the extraction of other resources like Gold, Coal or Diamonds.
For Instance, Johannesburg, South Africa is the largest City in South Africa and is one of the 50 largest urban areas in the world. It is also located in the mineral rich Witwatersrand range of hills and is the centre of large-scale gold and diamond trade.
Johannesburg is also one of the only major cities of the world that was not built on a river or harbour. However, it does have streams that contribute to two of Southern Africas mightiest rivers – Limpopo and the Orange rivers. However, most of the springs from which many of these streams emanate are now covered in concrete!
Water Stress and Agriculture
Peter Buss, co-founder of Sentek Technology calls ground moisture a water bank and manufactures ground sensors to interrogate it. His hometown of Adelaide is in one of the driest states in Australia. This makes monitoring soil water even more critical, if agriculture is to continue. Sentek has been helping farmers deliver optimum amounts of water since 1992.
The analogy of a water bank is interesting. Agriculturists must ?bank? water for less-than-rainy days instead of squeezing the last drop. They need a stream of real-time data and utilize cloud-based storage and processing power to curate it.
Sentek?s technology can be found in remote places like Peru?s Atacamba desert and the mountains of Mongolia, where it supports sustainable floriculture, forestry, horticulture, pastures, row crops and viticulture through precise delivery of scarce water.
This relies on precision measurement using a variety of drill and drop probes with sensors fixed at 4? / 10cm increments along multiples of 12? / 30cm up to 4 times. These probe soil moisture, soil temperature and soil salinity, and are readily repositioned to other locations as crops rotate.
Peter Buss is convinced that measurement is a means to an end and only the beginning. ?Too often, growers start watering when plants don’t really need it, wasting water, energy, and labour. By accurately monitoring water can be saved until when the plant really needs it.
Peter also emphasises that crop is the ultimate sensor, and that ?we should ask the plant what it needs?.
This takes the debate a stage further. Water wise farmers should plant water-wise crops, not try to close the stable door after the horse has bolted and dry years return.
The South Australia government thinks the answer also lies in correct farm dam management. It wants farmers to build ones that allow sufficient water to bypass in order to sustain the natural environment too.
There is more to water management than squeezing the last drop. Soil moisture goes beyond measuring for profit. It is about farming sustainably using data from sensors to guide us.
Ecovaro is ahead of the curve as we explore imaginative ways to exploit the data these provide for the common good of all.
A Quarter of the World?s Population, Face High Water Stress
Data from WRI?s Aqueduct tools reveal that 17 countries? home to one-quarter of the world?s population?face ?extremely high? levels of baseline water stress, where irrigated agriculture, industries and municipalities withdraw more than 80% of their available supply on average every year.
Water stress poses serious threats to human lives, livelihoods and business stability. It’s poised to worsen unless countries act: Population growth, socioeconomic development and urbanization are increasing water demands, while climate change can make precipitation and demand more variable.
How to manage water stress
Water stress is just one dimension of water security. However, like any challenge, its outlook depends on adequate monitoring and management of environmental data.
Even countries with relatively high water stress have effectively secured their water supplies through proper management by leveraging the knowledge they have garnered by learning from the data they gathered.
3 ways to help reduce water stress
In any geography, water stress can be reduced by measures ranging from common sense to innovative technology solutions.
There are countless solutions, but here are three of the most straightforward:
1. Increase agricultural efficiency: The world needs to make every drop of water go further in its food systems. Farmers can use seeds that require less water and improve their irrigation techniques by using precision watering rather than flooding their fields.
Businesses need to increase investments to improve water productivity, while engineers develop technologies that improve efficiency in agriculture.
2. Invest in grey and green infrastructure: D Data produced by Aqueduct Alliance – shows that water stress can vary tremendously over the year. WRI and the World Bank?s researchshows that built infrastructure (like pipes and treatment plants) and green infrastructure (like wetlands and healthy watersheds) can work in tandem to tackle issues of both water supply and water quality.
3. Treat, reuse and recycle: We need to stop thinking of wastewater as waste.
Treating and reusing it creates a ?new? water source.
There are also useful resources in wastewater that can be harvested to help lower water treatment costs. For example, plants in Xiangyang, China and Washington, D.C. reuse or sell the energy- and nutrient-rich byproducts captured during wastewater treatment.
Summary
The data is undeniably clear, there are very worrying trends in water.
Businesses and other other organisations need to start taking action now and investing in better monitoring and management, we can solve water issues for the good of people, economies and the planet. We collectively cannot kick this can down the road any further, or assume that this problem will be solved by others.
It is time, for a collective sense of responsibility and for everyone to invest in future prosperity of our Planet as a collective whole. Ecological preservation should be at the forefront of all business plans because at the end of the day profit is meaningless without an environment to enjoy it in!