What Heijunka is & How it Smooths Call Centre Production

The Japanese word Heijunka, pronounced hi-JUNE-kuh means ?levelling? in the sense of balancing workflows. It helps lean organizations shift priorities in the face of fluctuating customer demand. The goal is to have the entire operation working at the same pace throughout, by continuously adjusting the balance between predictability, flexibility, and stability to level out demand.

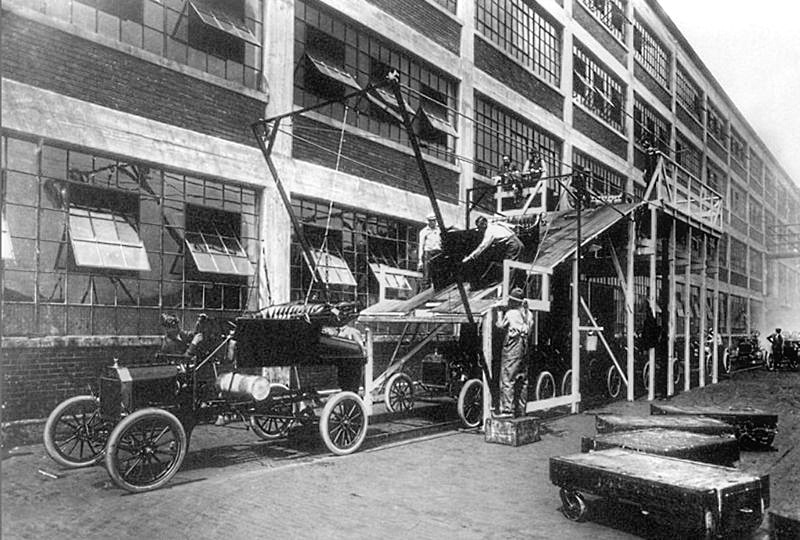
Henry Ford turned the American motor manufacturing industry upside down by mass-producing his iconic black motor cars on two separate production lines. In this photograph, body shells manufactured upstairs come down a ramp and drop onto a procession of cars almost ready to roll in 1913.

Smoothing Production in the Call Centre Industry

Call Centres work best in small teams, each with a supervisor to take over complex conversations. In the past, these tended to operate in silos with each group in semi-isolation representing a different set of clients. Calls came through to operators the instant the previous ones concluded. By the law of averages, inevitably one had more workload than the rest at a particular point in time as per this example.

Modern telecoms technology makes it possible to switch incoming lines to different call centre teams, provided these are multi-skilled. A central operator controls this manually by observing imbalanced workflows on a visual system called a Heijunka Box. The following example comes from a different industry, and highlights how eight teams share uneven demand for six products.

This departure from building handmade automobiles allowed Henry to move his workforce around to eliminate bottlenecks. For example, if rolls of seat leather arrived late he could send extra hands upstairs to speed up the work there, while simultaneously slowing chassis production. Ford had the further advantage of a virtual monopoly in the affordable car market. He made his cars at the rate that suited him best, with waiting lists extending for months.

A Modern, More Flexible Approach

Forces of open competition and the Six Sigma drive for as-close-to-zero defects dictates a more flexible approach, as embodied in this image published by the Six Sigma organisation. This represents an ideal state. In reality, one force usually has greater influence, for example decreasing stability enforces a more flexible approach.

Years ago, Japanese car manufacturer Toyota moved away from batching in favour of a more customer-centric approach, whereby buyers could customise orders from options held in stock for different variations of the same basic model. The most effective approach lies somewhere between Henry Ford?s inflexibility and Toyota?s openness, subject to the circumstances at the moment.

A Worked Factory Example

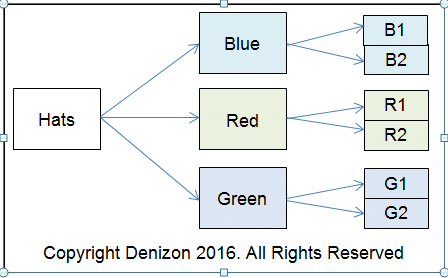
The following diagram suggests a practical Heijunka application in a factory producing three colours of identical hats. There are two machines for each option, one or both of which may be running. In the event of a large order for say blue hats, the company has the option of shifting some blue raw material to the red and green lines so to have the entire operation working at a similar rate.

Predictability, Flexibility, and Stability at Call Centre Service

The rate of incoming calls is a moving average characterised by spikes in demand. Since the caller has no knowledge whether high activity advisories are genuine, it is important to service them as quickly as possible. Lean process engineering provides technology to facilitate flexibility. Depending on individual circumstances, each call centre may have its own definition of what constitutes an acceptably stable situation.

Contact Us

  • (+353)(0)1-443-3807 – IRL
  • (+44)(0)20-7193-9751 – UK

Check our similar posts

What is Business Intelligence?

How well do you know your customers? That is, can you actually pinpoint which among them are you most profitable with and which are making you spend more? Are you content with the accuracy of your forecasts and market predictions? Do you feel you’re spending more on legal costs and regulatory compliance than you should?

Your IT department may be handling these concerns pretty well but perhaps you’d like to know how you can further improve things.

What we’ve got is an IT solution wrapped in a fancy name called ‘Business Intelligence’ or BI. If you think that’s too strong a term, we invite you to read more below, then you be the judge.

Dashboards – Determine the health of your business at a glance

Most drivers rarely make use of their car’s dashboard. After all, you can still reach your destination by just using the steering wheel, pedals, gear stick and so on. But that’s not exactly the most efficient way to drive, right?

If you want to save on fuel, you’ll want to glance on the RPM and speedometer from time to time. You might also want to utilise the trip meter to determine which route is the shortest to a given destination. Other dashboard components like the fuel gauge, tire pressure gauge, engine temperature indicator, and volt meter can likewise provide information about your car’s health.

The same concept applies to business management. If you want to run your business intelligently, you can make use of BI dashboards. These are tools in a typical business intelligence package that will allow you to determine the health of your business via a set of smartly configured gauges and other intuitive graphical representations.

So that, literally, at a mere glance, you’ll already know whether various units in your company are working efficiently. A dashboard will also give you instant feedback of the strategies you’ve recently implemented; to let you know if things are working as planned.

If you want more information than a dashboard can provide, our BI packages also include highly customised reports.

Reports that help you decide faster

Dashboards are great for getting valuable information at a glance but they won’t tell you everything. For more details, you’ll need to view highly customised reports. Our reports are tailor made for each user. We see to it that, by default, each person gets the information he needs the most.

If you belong to the sales department, you normally won’t need a presentation of the data that is appropriate for people in accounting. That way, you don’t spend time filtering. Instead, you and your people can move on to making well-informed decisions.

Our BI systems make use of your vast collection of data to provide reports that will organise your regulatory requirements and call your attention to approaching deadlines. The same system will provide the right information for your people on the field. If your team members are equipped with smart phones and Pocket PCs, they can retrieve whatever it is they need to know to close deals, make sales, and serve clients faster than the competition.

Generating logical information from disparate sources of data scattered over an enterprise-wide organisation is no easy task. But we’ll make it look simple. That’s because we’ve got the expertise to bring it all together into a robust data warehouse and to extract them in the form of reports and dashboards through OLAP.

OLAP and Data Warehousing – Powering the generation of actionable information

Want to know how to generate reports with the highest degree of accuracy and reliability? In theory, what you need is a single repository or a data warehouse. That is, order receipts, sales invoices, as well as customer & supplier data is integrated with regulatory details, personnel data, and others. These are all specially organised for future reporting and analysis.

However, data, no matter how all-embracing, is useless until it is processed into actionable information. Through OLAP or Online Analytical Processing, you can seamlessly collect all relevant data from your vast repository to answer queries like “What is our company’s profitability for the 2nd quarter in all identified key cities for our top-of-the-line products?”.

The strength of OLAP lies in its inherent ability to perform data analysis and very complex calculations, thus enabling it to return complex queries much faster than other database technologies. It is therefore suitable for very large data sources, i.e., data warehouses.

Dashboards and reports will only give your organisation the edge if the information retrieved is reliable, fast, and accurate – exactly the kind OLAP is so good at.

Mobile BI – Step back and see the big picture anytime, anywhere

Spreadsheets are great for displaying detailed information. However, in today’s highly competitive market, retrieving information that matters the most in the shortest possible time is vital in maintaining a sizeable lead over the competition. To step back and see the big picture, you’ll need insightful tools like dashboards and automatically generated reports.

Reports can be beamed to mobile devices such as smart phones and Pocket PCs. They can also be viewed on eBook readers as well. You can also do the same tasks with spreadsheets. But imagine how you’d need to scroll over a large spreadsheet on any of these mobile devices just to know which customer in your current location has performed well over the last month.

If you really want to make quick, well-informed decisions, BI dashboards for mobile devices is the way to go. You can make use of various business objects such as drill-able charts, performance metrics, and metric trend graphs to make crucial decisions even when on you’re in the field.

Monitoring Water Banks with Telemetrics

Longstanding droughts across South Australia are forcing farmers to rethink the moisture in the soil they once regarded as their inalienable right. Trend monitoring is an essential input to applying pesticides and fertilisers in balanced ratios. Soil moisture sensors are transmitting data to central points for onward processing on a cloud, and this is making a positive difference to agricultural output.

Peter Buss, co-founder of Sentek Technology calls ground moisture a water bank and manufactures ground sensors to interrogate it. His hometown of Adelaide is in one of the driest states in Australia. This makes monitoring soil water even more critical, if agriculture is to continue. Sentek has been helping farmers deliver optimum amounts of water since 1992.

The analogy of a water bank is interesting. Agriculturists must ?bank? water for less-than-rainy days instead of squeezing the last drop. They need a stream of online data and a safe place somewhere in the cloud to curate it. Sentek is in the lead in places as remote as Peru?s Atacamba desert and the mountains of Mongolia, where it supports sustainable floriculture, forestry, horticulture, pastures, row crops and viticulture through precise delivery of scarce water.

This relies on precision measurement using a variety of drill and drop probes with sensors fixed at 4? / 10cm increments along multiples of 12? / 30cm up to 4 times. These probe soil moisture, soil temperature and soil salinity, and are readily re-positioned to other locations as crops rotate.

Peter Buss is convinced that measurement is a means to the end and only the beginning. ?Too often, growers start watering when plants don’t really need it, wasting water, energy, and labour. By monitoring that need accurately, that water can be saved until later when the plant really needs it.? He goes on to add that the crop is the ultimate sensor, and that ?we should ask the plant what it needs?.

This takes the debate a stage further. Water wise farmers should plant water-wise crops, not try to close the stable door after the horse has bolted and dry years return. The South Australia government thinks the answer also lies in correct farm dam management. It wants farmers to build ones that allow sufficient water to bypass in order to sustain the natural environment too.

There is more to water management than squeezing the last drop. Soil moisture goes beyond measuring for profit. It is about farming sustainably using data from sensors to guide us. ecoVaro is ahead of the curve as we explore imaginative ways to exploit the data these provide for the common good of all.

How Ventura Bus Lines cleaned up its Act

Melbourne?s Ventura Bus Lines grew from a single bus in 1924 to a mega 308-vehicle fleet by the start of 2014. The family-owned provider has always been community centric; when climate-change became an issue it took quick and urgent action. As a result it now stands head and shoulders above many others. Let’s take a closer look at some of its decisions that made the difference.

The Important Things to Focus On

Ethanol Buses ? Ventura is the only Australian company that uses ethanol power produced from sugar cane for experimental public transport. It compares emissions within its fleet, and knows that these produce significantly less CO2 while also creating jobs for locals.

Electric Buses ? The company has been operating electric buses since 2009. These carry 42 seated among a total 68 passengers. The ride is smooth thanks to twin battery banks kept charged by braking and forward momentum. When required, a two-litre VW engine kicks in automatically.

Ongoing Driver Training ? Ventura provides regular retraining sessions emphasising safe, environmentally-friending operations. Drivers are able to see their fuel consumption and carbon emissions online and experiment with ways to improve these.

Bus U-Turns ? The capacity to measure throughput convinced the company to abandon the principle that buses don’t do U-Turns for safety?s sake. Road re-engineering made this possible in a busy downtown street. This reduced emissions equivalent to 4,000 cars and reduced vehicle downtime for servicing.

Increased Business – These initiatives allowed Ventura Bus Lines to improve its service as customers experience it. This led to an uptake in patronage and a corresponding downturn in the number of passenger car hours. The pleasure of travelling green no doubt contributed to this.

How Measuring Made the Difference

Ventura Bus Lines is big business. Its 308 buses operate out of 5 depots, cover 31% of the metropole, and transport close to 70,000 passengers on average daily which is no minor task. The ability to track, measure and analyse carbon emissions throughout the area has earned it compliance with National Greenhouse Energy Reporting Threshold 1 legislation.

It also uses the data to re-engineer bus routes to further reduce fuel consumption, energy consumption and operating costs. It’s amazing how measuring is affecting its bottom line, and the health of the Melbourne community at large.

Contact Us

  • (+353)(0)1-443-3807 – IRL
  • (+44)(0)20-7193-9751 – UK

Ready to work with Denizon?