Field Service Management (FSM) software systems are designed to enable you to manage your mobile workforce from a central point- and do away with the paperwork involved with the process. They connect your technicians on the ground (via app on their phones), to the staff at the head office- who have an interactive dashboard accessed through their browsers. The office team will have access to all the jobs that are to be handled by the company, simplifying the management process and taking away the risks that come with manual data entry. Here, we will walk you through a quick process of scheduling a job for your personnel with FieldElite.
Say you are a HVAC contractor, licensed, bonded and insured. You’ve made quite a name for yourself in the industry, and have a wide range of clients- in both residential and commercial establishments. Consequently, you also have a large workforce to attend to the different situations- from installing to repair and maintenance. One of your clients- let’s call them ABC Computer Supplies, has an issue with their HVAC unit- perhaps a pipe is leaking. It needs to be fixed, and ABC have booked an appointment.? Your goal here is to get one of your personnel to handle the task as soon as possible, and this field service scheduling software comes in handy.
There are two approaches that you can take:
1. Job Scheduling
From your Dashboard, on the left-hand side you will see the menu option. Clicking on Jobs, will take you to all jobs carried out by your company.
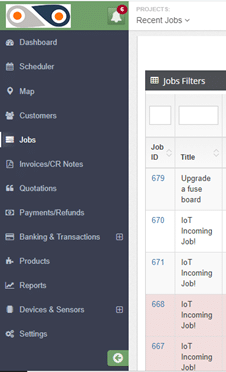
The filters will allow you to view different categories of jobs:
- Complaint– This means that there was an issue with on ground during the task delivery, and the client lodged a complaint.
- On hold– Here, different aspects can cause a job to be paused- like when spare parts or equipment required for repair jobs have been ordered, and one needs to wait for them to be shipped in from a different location.
- Pending– This is basically your in-tray, a list of jobs that are to be carried out.
- In Progress– The technicians are on the ground, attending to the client’s needs, and you’re getting routine updates from them.
- Incomplete– Though the job had been assigned to the required technician, it was not completed in the set amount of time, thus requiring an additional visit to the site. Given that the FSM solution increases the first-time fix rate, cases of ?incomplete tasks? are reduced.
- Complete– The task is successfully done and the customer has appended their e-signature, and now it can be invoiced.
- Cancelled Invoice– The head office determines that a particular invoice shouldn’t be paid, and thus cancels it.
Our focus here is the pending tasks, so use this filter. ABC’s HVAC job will be among these. Clicking on its Job ID will open up the details of the task, with such an Update Job window:
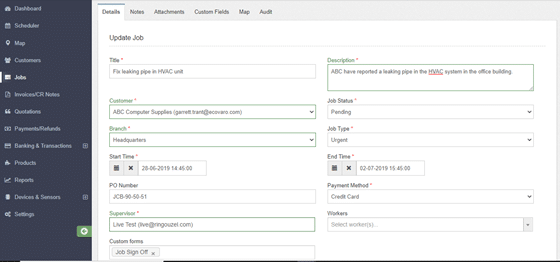
This section contains all the information of the job- both past and present, which you can update in real-time. Any changes will be recorded by the system and can be viewed on the “Audit” tab.
As you can see here, the HVAC repair job is both “pending” and “urgent”. No one really likes sitting in an office that feels like an oven. Being the headquarters, it’s likely handles lots of foot traffic, and the damaged HVAC unit will make the working conditions really difficult. It’s best not to keep the client waiting, right?
So, head on over to the Supervisor and Workers section (on the same “Details” tab), and select the personnel suited for the task.
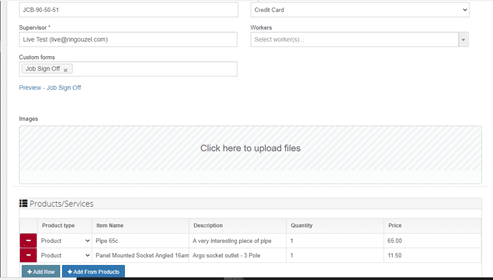
Set the time that the task will take for your technician, and once satisfied with the details of the job, click on Update. Voila! You’re done.
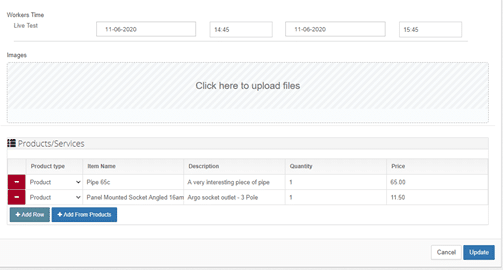
Immediately this happens, the worker received a notification on their app, telling them that they have been assigned the job.
From the app, the technician will be able to view the specifics of the HVAC job, including notes and attachments that you can add directly from your own dashboard, such as schematics of the building and reports from other technicians who installed the air conditioning system for the facility. You also get to add products that will be required for the task- like the pipe and panel mounted socket shown here. As the system also includes an inventory of the products used, their quantity and costs, you will be able to keep an accurate record of the supplies as they as are used.
As such, the field workers will not have to keep coming back to the central office to get documents and reports of new tasks, or walk around with bulky files. When they are carrying out the job, they will also be able to keep the staff at the office updated about its progress, through the chat feature on the mobile app, taking photos and adding notes as required.
2. Staff Scheduling
With this approach, the perspective is basically: ?So I have a couple of jobs- which of my employees has time to handle them?? The FSM allows you to optimise your productivity- by ensuring that you get the most out of the staff work hours, and avoid cases of jobs going into overtime.
Follow these steps:
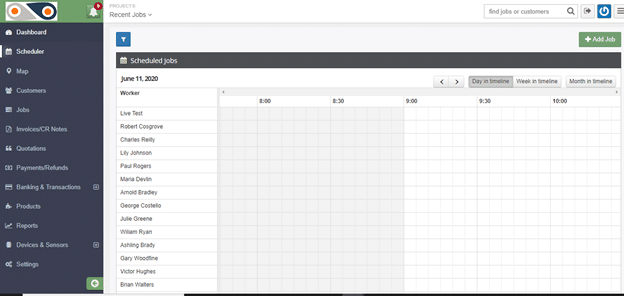
- Select ?Scheduler? from the left-hand side of the window. You will have a view of the workers of your company and how their day is planned out, and a summary of the unassigned jobs.
Here, you can tell whose busy, and who can have a new task assigned to them at the click of a button- which is far more effective than keeping on jotting down points in your diary or going through files of documents.
If the job has yet to be added to the system- like for the cases of new clients, simply click on the ?Add Job? button and key in its details.
2. Scroll down, you will see a list of unassigned jobs.
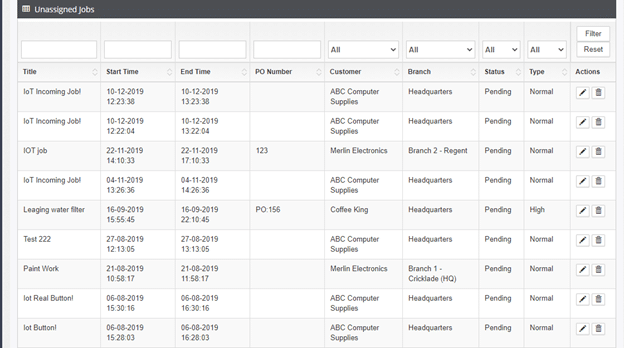
3. Next, click on the edit button under ?Actions?. This will take you to the same ?Update Job? window described in the first approach, in order to assign the preferred worker to the role.
This real-time dispatching avoids cases of your desk getting cluttered with paper sheets, and prevents duplicate entries as each job has its own ID and task details- from the scheduling to the invoicing. In this case, your HVAC technician will have access to the information needed right at the palm of their hand, to ensure that the task at ABC?s head office goes seamlessly. The optimised schedule will enable the task to be carried out faster- restoring normalcy to your client’s facility.? In case the client’s location is on the route that one of your technicians takes while heading home, you can take advantage of this by giving them the task towards the end of their working day- thus clearing more of your backlog, sorting out your client, and easing your technician?s worries about getting home late.
As you can see, the field service scheduling software enables you to easily and efficiently handle your workflow, avoid the mess that is associated with manual documentation and cases of your employees getting conflicting schedules and overlaps- which would strain them and dampen their morale. Streamlining your workflow and standardising operations ultimately results in increased customer satisfaction.


