How DevOps oils the Value Chain

DevOps ? a clipped compound of development and operations – is a way of working whereby software developers are in a team with project beneficiaries. A client centred approach extends the project plan to include the life cycle of the product or service, for which the software is developed.

We can then no longer speak of a software project for say Joe?s Accounting App. The software has no intrinsic value of its own. It follows that the software engineers are building an accounting app product. This is a small, crucially important distinction, because they are no longer in a silo with different business interests.

To take the analogy further, the developers are no longer contractors possibly trying to stretch out the process. They are members of Joe?s accounting company, and they are just as keen to get to market fast as Joe is to start earning income. DevOps uses this synergy to achieve the overarching business goal.

A Brief Introduction to OpsDev

You can skip this section if you already read this article. If not then you need to know that DevOps is a culture, not a working method. The three ?members? are the software developers, the beneficiaries, and a quality control mechanism. The developers break their task into smaller chunks instead of releasing the code to quality control as a single batch. As a result, the review process happens contiguously along these simplified lines.

Code QC Test ? ? ?
? Code QC Test ? ?
? ? Code QC Test ?
? ? ? Code QC Test
Colour Key Developers Quality Control Beneficiary

This is a marked improvement over the previously cumbersome method below.

Write the Code ? Test the Code ? Use the Code
? Evaluate, Schedule for Next Review ?

Working quickly and releasing smaller amounts of code means the OpsDev team learns quickly from mistakes, and should come to product release ahead of any competitor using the older, more linear method. The shared method of working releases huge resources in terms of user experience and in-line QC practices. Instead of being in a silo working on its own, development finds it has a richer brief and more support from being ?on the same side of the organisation?.

The Key Role that Application Program Interfaces Play

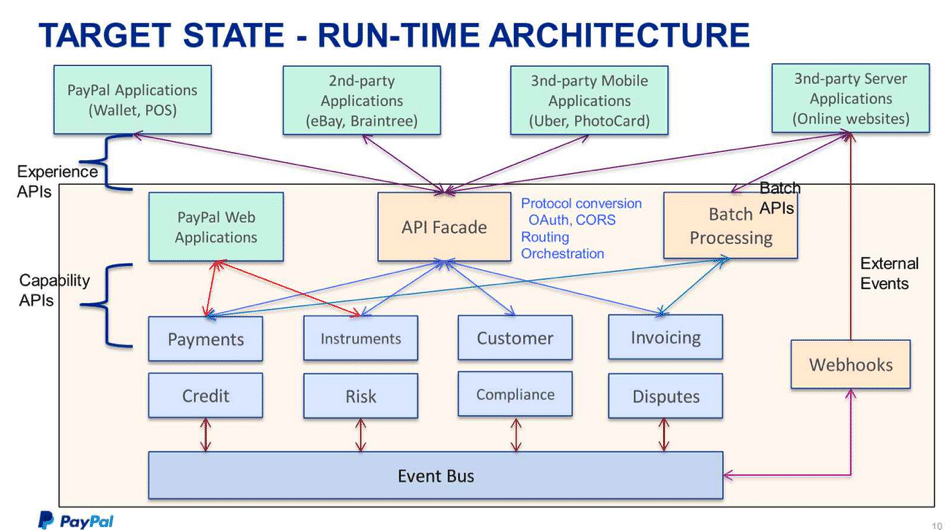
Application Program Interfaces, or API?s for short, are building blocks for software applications. Using proprietary software-bridges speeds this process up. A good example would be the PayPal applications that we find on so many websites today. API?s are not just for commercial sites, and they can reduce costs and improve efficiency considerably.

The following diagram courtesy of TIBCO illustrates how second-party applications integrate with PayPal architecture via an API fa?ade.

Working quickly and releasing smaller amounts of code means the OpsDev team learns quickly from mistakes, and should come to product release ahead of any competitor using the older, more linear method. The shared method of working releases huge resources in terms of user experience and in-line QC practices. Instead of being in a silo working on its own, development finds it has a richer brief and more support from being ?on the same side of the organisation?.

imgd2.jpg

The DevOps Revolution Continues ?

We close with some important insights from an interview with Jim Stoneham. He was general manager of the Yahoo Communities business unit, at the time Flickr became a part. ?Flickr was a codebase,? Jim recalls, ?that evolved to operate at high scale over 7 years – and continuing to scale while adding and refining features was no small challenge. During this transition, it was a huge advantage that there was such an integrated dev and ops team?

The ?maturity model? as engineers refer to DevOps status currently, enables developers to learn faster, and deploy upgrades ahead of their competitors. This means the client reaches and exceeds break-even sooner. DevOps lubricates the value chain so companies add value to a product faster. One reason it worked so well with Flickr, was the immense trust between Dev and Ops, and that is a lesson we should learn.

?We transformed from a team of employees to a team of owners. When you move at that speed, and are looking at the numbers and the results daily, your investment level radically changes. This just can’t happen in teams that release quarterly, and it’s difficult even with monthly cycles.? (Jim Stoneham)

Contact Us

  • (+353)(0)1-443-3807 – IRL
  • (+44)(0)20-7193-9751 – UK

Check our similar posts

Sources of Carbon Emissions

Exchange of carbon dioxide among the atmosphere, land surface and oceans is performed by humans, animals, plants and even microorganisms. With this, they are the ones responsible for both producing and absorbing carbon in the environment. Nature?s cycle of CO2 emission and removal was once balanced, however, the Industrial Revolution began and the carbon cycle started to go wrong. The fact is that human activities substantially contributed to the addition of CO2 in the atmosphere.

According to statistics gathered by the Department of Energy and Climate Change, carbon dioxide comprises 82% of UK?s greenhouse gas emissions in 2012. This makes carbon dioxide the main greenhouse gas contributing to the pollution and subsequent climate change in UK.

Types of Carbon Emissions

There are two types of carbon emissions ? direct and indirect. It is easier to measure the direct emissions of carbon dioxide, which includes the electricity and gas people use in their homes, the petrol burned in cars, distance of flights taken and other carbon emissions people are personally responsible for. Various tools are already available to measure direct emissions each day.

Indirect emissions, on the other hand, include the processes involved in manufacturing food and products and transporting them to users? doors. It is a bit difficult to accurately measure the amount of indirect emission.

Sources of Carbon Emissions

The sources of carbon emissions refer to the sectors of end-users that directly emit them. They include the energy, transport, business, residential, agriculture, waste management, industrial processes and public sectors. Let’s learn how these sources contribute carbon emissions to the environment.

Energy Supply

The power stations that burn coal, oil or gas to generate electricity hold the largest portion of the total carbon emissions. The carbon dioxide is emitted from boilers at the bottom of the chimney. The electricity, produced from the fossil fuel combustion, emits carbon as it is supplied to homes, commercial establishments and other energy users.

Transport

The second largest carbon-emitting source is the transport sector. This results from the fuels burned in diesel and petrol to propel cars, railways, shipping vehicles, aircraft support vehicles and aviation, transporting people and products from one place to another. The longer the distance travelled, the more fuel is used and the more carbon is emitted.

Business

This comprises carbon emissions from combustion in the industrial and commercial sectors, off-road machinery, air conditioning and refrigeration.

Residential

Heating houses and using electricity in the house, produce carbon dioxide. The same holds true to cooking and using garden machinery at home.

Agriculture

The agricultural sector also produces carbon dioxide from soils, livestock, immovable combustion sources and other machinery associated with agricultural activities.

Waste Management

Disposing of wastes to landfill sites, burning them and treating waste water also emit carbon dioxide and contributes to global warming.

Industrial Processes

The factories that manufacture and process products and food also release CO2 , especially those factories that manufacture steel and iron.

Public

Public sector buildings that generate power from fuel combustion also add to the list of carbon emission sources, from heating to other public energy needs.

Everybody needs energy and people burn fossil fuels to create it. Knowing how our energy use affects the environment, as a whole, enables us to take a step ahead towards achieving better climate.

Contact Us

  • (+353)(0)1-443-3807 – IRL
  • (+44)(0)20-7193-9751 – UK
ESOS Guide for UK Manufacturers Available

The Engineering Employers’ Federation (EEF) is the UK’s largest sectoral structure. Its goal is to promote the interests of manufacturing, engineering and technology-based businesses in order to enhance their competitiveness.

EEF has positioned itself in London and Brussels in order to be in a position to lobby at EU and Westminster level. Part of its role is helping its members adapt to change and capitalise on it. When it discovered that a third of UK manufacturers must comply with ESOS (and 49% had not even heard of it) EEF decided it was time to publish a handbook for its members.

According to EEF’s head of climate and environment policy Gareth Stace, For the many manufacturers that have already taken significant steps to improve energy efficiency, ESOS can be viewed as a ?stock taking exercise?, ensuring that momentum is maintained and new measures are highlighted and taken when possible?.

He goes on to add that others that have not begun the process should view it as an ‘impetus’ to go head down and find the most cost-effective ways to slash energy costs. Ecovaro adds that they would also have the opportunity to reduce carbon emissions almost as a by-product.

Firms with more than 250 employees, over 250 million revenue or both must comply with ESOS across all UK sectors. In simplest terms, they must have conducted an energy audit by 5th December 2015, and logged their energy saving plan with the Environmental Agency that is Britain?s sustainability watchdog.

The Department of Energy & Climate Change (DEEC) that oversees it believes that large UK businesses are wasting ?2.8 billion a year on electricity they do not need. Clearly it makes sense to focus on larger targets; however EcoVaro believes those halfway to the threshold should voluntarily comply if cutting their energy bills by 25% sounds appealing.

We are able to assist with interpreting their energy audits. These are often a matter of installing sub-meters at distribution points, and reading these for a few representative months to establish a trend. Meters are inexpensive compared to electricity costs, and maintenance teams can install them during maintenance shutdowns.

Ecovaro helps these firms process the data into manageable summaries using cloud-based technology. This is on a pay-when-used basis, and hence considerably cheaper than acquiring the software, or appointing a consultant.

How Energy Conservation saved Fambeau River Paper

Rising energy costs caught this Wisconsin paper mill napping, and it soon shut down because it was unable to innovate. Someone else bought it and turned it around by measuring, modifying, monitoring and listening to people.

The Fambeau River Paper Mill in Prince County, Wisconsin USA employed 13% of the city?s residents until rising energy costs shut it down in 2006. Critics wrote it off as an energy dinosaur unable to adapt. But that was before another company bought it out and resuscitated it as a fleet-footed winner.

Its collapse was a long time coming and almost inevitable. Wisconsin electricity prices had grown a third since 1997, the machinery was antiquated and the dependence on fossil power absolute. So what did the new owners change, and is there anything we can learn from this?

The key to understanding what suddenly went right was the new owners? ability to listen. They requested a government Energy Assessment that suggested a number of small step changes that took them where they needed to go in terms of energy saving. These included enhancements in steam systems and fuel switch modifications. However they needed more than that.

The second game changer was tracking down key members of the old workforce and listening to them too. This combination enabled them to finally hire back 92% of the original labour force under the same terms and conditions – and still make a profit (the other 8% had moved on elsewhere or retired). The combined energy savings produced a payback plan of 5.25 years. Three years into the project their capital investment of $15 million had already clawed back the following electricity savings.

  • Evaporator Temperature Control $2,245,000
  • Hot Water Heat Recovery $2,105,000
  • Paper Machine Devronisers $1,400,000
  • Increased Boiler Output $1,134,000
  • Paper Machine Modifications; $761,000
  • Motive Air Dryer $610,000
  • Accumulator Savings $448,000
  • Densified Fuels Plant $356,000

In terms of carbon dioxide produced, the Fambeau River Paper Mill?s contribution dropped from 1 ton to 600 pounds.

How well do you know where your company?s energy spend is concentrated, and how this compares with your industry average; could you be doing better if you innovated, and by how much? Get these questions answered by asking ecoVaro how easy it could be to get on top of your carbon metrics. This could cost you a phone call and a payback on it so rapid it’s not worth stopping to calculate.

Contact Us

  • (+353)(0)1-443-3807 – IRL
  • (+44)(0)20-7193-9751 – UK

Ready to work with Denizon?