What Heijunka is & How it Smooths Call Centre Production
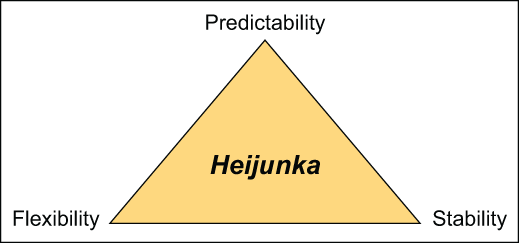
The Japanese word Heijunka, pronounced hi-JUNE-kuh means ?levelling? in the sense of balancing workflows. It helps lean organizations shift priorities in the face of fluctuating customer demand. The goal is to have the entire operation working at the same pace throughout, by continuously adjusting the balance between predictability, flexibility, and stability to level out demand.
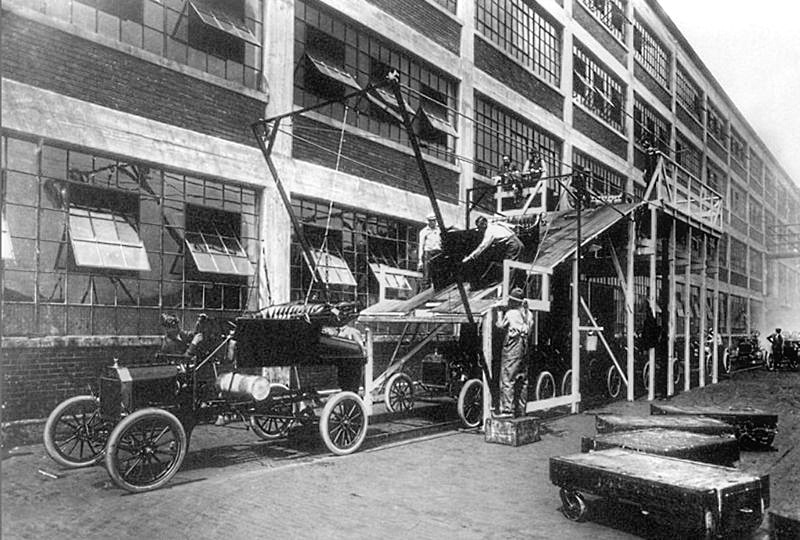
Henry Ford turned the American motor manufacturing industry upside down by mass-producing his iconic black motor cars on two separate production lines. In this photograph, body shells manufactured upstairs come down a ramp and drop onto a procession of cars almost ready to roll in 1913.
Smoothing Production in the Call Centre Industry
Call Centres work best in small teams, each with a supervisor to take over complex conversations. In the past, these tended to operate in silos with each group in semi-isolation representing a different set of clients. Calls came through to operators the instant the previous ones concluded. By the law of averages, inevitably one had more workload than the rest at a particular point in time as per this example.
Modern telecoms technology makes it possible to switch incoming lines to different call centre teams, provided these are multi-skilled. A central operator controls this manually by observing imbalanced workflows on a visual system called a Heijunka Box. The following example comes from a different industry, and highlights how eight teams share uneven demand for six products.
This departure from building handmade automobiles allowed Henry to move his workforce around to eliminate bottlenecks. For example, if rolls of seat leather arrived late he could send extra hands upstairs to speed up the work there, while simultaneously slowing chassis production. Ford had the further advantage of a virtual monopoly in the affordable car market. He made his cars at the rate that suited him best, with waiting lists extending for months.
A Modern, More Flexible Approach
Forces of open competition and the Six Sigma drive for as-close-to-zero defects dictates a more flexible approach, as embodied in this image published by the Six Sigma organisation. This represents an ideal state. In reality, one force usually has greater influence, for example decreasing stability enforces a more flexible approach.
Years ago, Japanese car manufacturer Toyota moved away from batching in favour of a more customer-centric approach, whereby buyers could customise orders from options held in stock for different variations of the same basic model. The most effective approach lies somewhere between Henry Ford?s inflexibility and Toyota?s openness, subject to the circumstances at the moment.
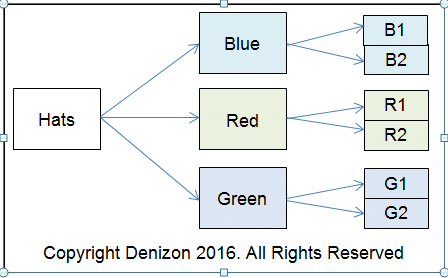
A Worked Factory Example
The following diagram suggests a practical Heijunka application in a factory producing three colours of identical hats. There are two machines for each option, one or both of which may be running. In the event of a large order for say blue hats, the company has the option of shifting some blue raw material to the red and green lines so to have the entire operation working at a similar rate.
Predictability, Flexibility, and Stability at Call Centre Service
The rate of incoming calls is a moving average characterised by spikes in demand. Since the caller has no knowledge whether high activity advisories are genuine, it is important to service them as quickly as possible. Lean process engineering provides technology to facilitate flexibility. Depending on individual circumstances, each call centre may have its own definition of what constitutes an acceptably stable situation.
About a quarter of the world’s population use the Internet. That’s approximately 1.7 billion people. How many will come to your site the moment it launches? Zero.
It will take some time before the search engines are able to index your site and allow the possibility of driving some visitor traffic there. But even when your site does get indexed, that’s no assurance people will even have the chance of finding it.
So unless you apply SEO, your chances of improving those traffic numbers from zilch would nearly be zilch too. Traffic is a fundamental prerequisite in eCommerce. Before any store, virtual or otherwise, can ever hope to make a sale, the first step is to get noticed by the potential customer.
Our SEO specialists can drive your pages to the top of search results so that potential customers can see results leading to your site first.
Depending on the product or service you’re offering, getting to be ranked high on the search engines can be extremely labour-intensive. Basically, it’s the kind of job you’d rather not keep in-house but its the kind of job our team would be happy to take charge on.
Different products and services have different SEO requirements. We won’t recommend an SEO package if we think it will only translate to unnecessary spending.
These are the essentials of our SEO packages:
Targeted keywords and keyphrases. We’ll conduct extensive research on your product line and your product competitors to get hold of the best targeted keywords and keyphrases. If your competitors missed any important keyphrases, we’ll find those as well.
Strategically planted backlinks. We’ll concentrate our backlinking efforts on relevant backlinks to achieve top search engine rankings. As an added bonus, relevant backlinks drive in traffic that really matter as this is made up of visitors with the highest potential of turning into buyers.
On-site SEO. Certain issues arising from the mere makeup of most eCommerce websites are making on-site SEO tweaking more challenging. In fact, not all SEO consultants cater to these specific problems. Our specialists, on the other hand, pay special attention to issues regarding pagination resulting in keyword cannibalisation, product pages, landing page optimisation and the like.
Selection of SEO packages. While you’re still starting out, you may want to try our basic packages first. Then once you see traffic pouring in and revenues begin to build up, you can up the ante by upgrading to our premium packages.
For many people within the UK, water is not really something to worry about. Surely enough of it falls out the sky throughout the year that it does feel highly unlikely that we?ll ever run out of it. There certainly does seem to be an abundance of Branded Water available in plastic bottles on our supermarket shelves.
Water, water, every where, And all the boards did shrink; Water, water, every where, Nor any drop to drink.
Despite this, Once-unthinkable water crises are becoming commonplace. If you consider that In England and Wales, we use 16 billion litres of clean drinking water every day ? that’s equivalent to 6,400 Olympic sized swimming pools.
Currently, water companies can provide slightly more than we need ? 2 billion litres are available above and beyond what we’re using. In some areas, though, such as south east England, there is no surplus and, as such, these regions are more likely to face supply restrictions in a dry year.
If we take little moment to reflect on some of the most notable water related stories over the past few years, we’ll start to get a picture of just how real the potential and the threat of water shortages can be.
Reservoirs in Chennai, India?s sixth-largest city, are nearly dry right now. Last year, residents of Cape Town, South Africa narrowly avoided their own Day Zero water shut-off.
It was only year before that, Rome rationed water to conserve scarce resources.
Climate change is likely to mean higher temperatures which may drive up the demand for water (alongside population growth) and increase evaporation from reservoirs and water courses during spring and summer.
The impact of climate change on total rainfall is uncertain, but the rain that does fall is likely to arrive in heavier bursts in winter and summer. Heavier rain tends to flow off land more quickly into rivers and out to sea, rather than recharging groundwater aquifers.
A greater chance of prolonged dry periods is also conceivable. This combined with the harsh reality that no human population can sustain itself without sufficient access to fresh water.
If present conditions continue, 2 out of 3 people on Earth will live within a water-stressed zone by 2025
What is water stress?
Water stress is a term used to describe situation when demand for water is greater than the amount of water available at a certain period in time, and also when water is of poor quality and this restricts its usage. Water stress means deterioration in both the quantity of available water and the quality of available water due to factors affecting available water.
Water stress refers to the ability, or lack thereof, to meet human and ecological demand for water. Compared to scarcity, water stress is a more inclusive and broader concept.
Water Stress considers several physical aspects related to water resources, including water scarcity, but also water quality, environmental flows, and the accessibility of water.
Supply and Demand
Major factors involved when water scarcity strikes is when a growing populations demand for water exceeds the areas ability to service that need.
Increased food production and development programs also lead to increased demand for water, which ultimately leads to water stress.
Increased need for agricultural irrigation in order to produce more crops or sustain livestock are major contributors to localised water stress.
Overconsumption
The demand for water in a given population is fairly unpredictable. Primarily, based on the fact that you can never accurately predict human behaviour and changes in climate.
If too many people are consuming more water than they need because they mistakenly believe that water is freely available and plentiful, then water stress could eventually occur.
This is also linked to perceived economic prosperity of a give region. Manufacturing demand for water can have huge impact regardless whether water is actively used within the manufacturing process or not.
Water Quality
Water quality in any given area is never static. Water stress could happen as a result of rising pollution levels having a direct impact on water quality.
Water contamination happens when new industries either knowingly or unknowingly contaminate water with their industrial practices.
Largely, this can happen and frequently does so because these industries do not take effective control of monitoring and managing their impact on communal water supplies. Incorrectly assuming this is the responsibility of an additional third party like the regional water company.
The truth is, water quality and careful monitoring of it is all of our responsibility.
Water Scarcity
Simple increases in demand for water can in itself contribute to water scarcity. However, these are often preceded by other factors like poverty or just the natural scarcity of water in the area.
In many instances, the initial locations of towns or cities were not influenced by the close proximity of natural resources like water, but rather in pursuit of the extraction of other resources like Gold, Coal or Diamonds.
For Instance, Johannesburg, South Africa is the largest City in South Africa and is one of the 50 largest urban areas in the world. It is also located in the mineral rich Witwatersrand range of hills and is the centre of large-scale gold and diamond trade.
Johannesburg is also one of the only major cities of the world that was not built on a river or harbour. However, it does have streams that contribute to two of Southern Africas mightiest rivers – Limpopo and the Orange rivers. However, most of the springs from which many of these streams emanate are now covered in concrete!
Water Stress and Agriculture
Peter Buss, co-founder of Sentek Technology calls ground moisture a water bank and manufactures ground sensors to interrogate it. His hometown of Adelaide is in one of the driest states in Australia. This makes monitoring soil water even more critical, if agriculture is to continue. Sentek has been helping farmers deliver optimum amounts of water since 1992.
The analogy of a water bank is interesting. Agriculturists must ?bank? water for less-than-rainy days instead of squeezing the last drop. They need a stream of real-time data and utilize cloud-based storage and processing power to curate it.
Sentek?s technology can be found in remote places like Peru?s Atacamba desert and the mountains of Mongolia, where it supports sustainable floriculture, forestry, horticulture, pastures, row crops and viticulture through precise delivery of scarce water.
This relies on precision measurement using a variety of drill and drop probes with sensors fixed at 4? / 10cm increments along multiples of 12? / 30cm up to 4 times. These probe soil moisture, soil temperature and soil salinity, and are readily repositioned to other locations as crops rotate.
Peter Buss is convinced that measurement is a means to an end and only the beginning. ?Too often, growers start watering when plants don’t really need it, wasting water, energy, and labour. By accurately monitoring water can be saved until when the plant really needs it.
Peter also emphasises that crop is the ultimate sensor, and that ?we should ask the plant what it needs?.
This takes the debate a stage further. Water wise farmers should plant water-wise crops, not try to close the stable door after the horse has bolted and dry years return.
The South Australia government thinks the answer also lies in correct farm dam management. It wants farmers to build ones that allow sufficient water to bypass in order to sustain the natural environment too.
There is more to water management than squeezing the last drop. Soil moisture goes beyond measuring for profit. It is about farming sustainably using data from sensors to guide us.
Ecovaro is ahead of the curve as we explore imaginative ways to exploit the data these provide for the common good of all.
A Quarter of the World?s Population, Face High Water Stress
Data from WRI?s Aqueduct tools reveal that 17 countries? home to one-quarter of the world?s population?face ?extremely high? levels of baseline water stress, where irrigated agriculture, industries and municipalities withdraw more than 80% of their available supply on average every year.
Water stress poses serious threats to human lives, livelihoods and business stability. It’s poised to worsen unless countries act: Population growth, socioeconomic development and urbanization are increasing water demands, while climate change can make precipitation and demand more variable.
How to manage water stress
Water stress is just one dimension of water security. However, like any challenge, its outlook depends on adequate monitoring and management of environmental data.
Even countries with relatively high water stress have effectively secured their water supplies through proper management by leveraging the knowledge they have garnered by learning from the data they gathered.
3 ways to help reduce water stress
In any geography, water stress can be reduced by measures ranging from common sense to innovative technology solutions.
There are countless solutions, but here are three of the most straightforward:
1. Increase agricultural efficiency: The world needs to make every drop of water go further in its food systems. Farmers can use seeds that require less water and improve their irrigation techniques by using precision watering rather than flooding their fields.
Businesses need to increase investments to improve water productivity, while engineers develop technologies that improve efficiency in agriculture.
2. Invest in grey and green infrastructure: D Data produced by Aqueduct Alliance – shows that water stress can vary tremendously over the year. WRI and the World Bank?s researchshows that built infrastructure (like pipes and treatment plants) and green infrastructure (like wetlands and healthy watersheds) can work in tandem to tackle issues of both water supply and water quality.
3. Treat, reuse and recycle: We need to stop thinking of wastewater as waste.
Treating and reusing it creates a ?new? water source.
There are also useful resources in wastewater that can be harvested to help lower water treatment costs. For example, plants in Xiangyang, China and Washington, D.C. reuse or sell the energy- and nutrient-rich byproducts captured during wastewater treatment.
Summary
The data is undeniably clear, there are very worrying trends in water.
Businesses and other other organisations need to start taking action now and investing in better monitoring and management, we can solve water issues for the good of people, economies and the planet. We collectively cannot kick this can down the road any further, or assume that this problem will be solved by others.
It is time, for a collective sense of responsibility and for everyone to invest in future prosperity of our Planet as a collective whole. Ecological preservation should be at the forefront of all business plans because at the end of the day profit is meaningless without an environment to enjoy it in!
They are the engine that drives your operations, but are you really giving you value for your money? How much time is spent by your personnel on lengthy paperwork and record-keeping, as opposed to actually providing the service to your customers? Manual tasks create bottlenecks and slow your operations, which in turn affects service delivery and customer satisfaction. You want to reach more clients and boost your brand image, growing your market share and generating more revenue. Field Service Management (FSM) software comes in optimise the operations of your mobile workforce, cut down resource wastage, and enhance your productivity as a firm, by actually enabling your field staff to get more done, thus achieving their individual goals. In fact, according to a report published by Fortune Business Insights?, the global FSM market- which stood at $2.29 billion as recently as 2018, will have expanded to $7.27 billion by 2026. What does this mean for your employees, and how do they benefit from FieldElite?
Skipping the paperwork with end-to-end automation
Filing reports, keeping track of equipment used, working on the Excel sheets for multiple jobs on a daily basis, all through to the routing and billing- it can be a logistical nightmare. It’s not just about the hours spent poring through documents and typing away at calculators. Manual work exposes you to the risks of human error. Missing records, inaccurate assessments of the situation on the ground due to the overwhelming data streaming in, putting the head office staff under strain- it all hampers the productivity of the company.
Take scheduling for instance. You have different employees, and various jobs that need their attention, at different locations. It can be a plumbing company whose clients have water filters that need to be repaired, gas boilers inspected, leaking pipes fixed, and others who need new installations to be set up. Assigning your personnel to the different situations will need to take into account the type of job, and the amount of time that it will require, aspects such as the location and the crew that is closest to it. At the head office you will want to keep tabs on the jobs that are in progress, pending, complete, those on hold, and even those that have been cancelled. Running all these through traditional manual processes is enough to drive you to the edge. What’s more, tasks that slip through your fingers amidst the confusion will result in negative feedback from your customers- which you don’t want hitting your brand.
With a field service job management software like FieldELite, you get to handle it all from one dashboard. Optimise your service delivery using the accurate scheduler, that allows you to account for the location of your employees, the status of the job- from the urgent ones like emergency tasks, to the normal duties such as routine maintenance, and low-priority tasks. The field service scheduling software comes with a real-time location feature that allows you to determine the employees closest to the client’s premises who will be appropriate for the job, map out the service areas and give you a birds-eye view of all the operations on the ground, while being updated with the progress of each specific task. Less time is spent travelling to- and from the central office, and more on actually tending to your client’s needs. You can even have situations where you can assign end-of-day tasks to employees who will be passing on that route on their way home.
Enhanced resource utilisation that promotes personal and professional development
Skill is key across the industries- from electrical services, solar panel installation, landscaping, home remodelling, pest control, plumbing, HVAC system maintenance, to construction and property management. For the job to be done appropriately and make your clients happy, you want to assign the task to an employee who is particularly proficient at it. This tends to be glimpsed over during manual scheduling since the personnel at the head office will be swamped with so many files, and will pick the first one that comes close to fitting the job description, leading to overlapping of roles. Sure, they may get it done, having seen their colleagues do it and even helping them out when they worked together before on similar projects- but will it be up to the required standard? On the other hand, the FSM allows you to ensure that you get the right technician for the task- who will be more motivated, boosting their performance.
What about accidents? Your employees want to feel safe as they go about their mandate. Many of the field service jobs are hazardous- such as electrical repair jobs, window cleaning tasks at high rise buildings, to elevator repair jobs where a slight glitch can lead to severe ramifications. Field service management software also comes in handy here, where the head office can be notified of any emergency the moment it occurs, and arrange for the necessary action to be taken immediately. That way, your employees will not feel neglected while they are out in the field, showing them that their safety is a priority to your business- which in turn increases their morale.
Readily available knowledgebase and feedback system
When the employees have been assigned a specific job, they will require certain information about it. This includes the scope of the task, history of previous repairs or maintenance that was carried out, accompanying images if needed, risk assessment, any hazards or contaminants that they will need to prepare for, to notes left by technicians who had handled it. Having to keep checking their email, or picking up documents at the office for the day’s job and walking around with them all day as they tend to one customer after another, will slow things down, and not to mention frustrate them. However, the FSM system is directly accessible by the employees via app on their phones. The information needed for each specific task will thus be at their fingertips, speeding up the process and ensuring that they will be ready for each project being handled.
While carrying out the job itself, the employees will use the very same app to update the system on how it is progressing, chat with the staff at the head office, update the inventory and even place orders for extra parts if necessary. Since mobile service management software apps like FieldElite also work in offline mode, the photos, reports and other entries that are made are collected by the app and saved on the device. Once a network connection is established, they are then updated to the central database- thus ensuring that the job can proceed regardless of the location.
Once the job is completed, the customer input is also taken, registered in the system through their e-signature. A signoff comment included gives the customer the opportunity to indicate their experience with the job, and the feedback that they would like to provide. In case the job has not been completed, then the scheduling software kicks in, putting it in queue for another appointment to take care of the task, or resolve the issue that had caused it not to be completed the first time. The completed tasks head right to invoicing, which is also handled within the field service management platform, making it a seamless task for the head office staff.