Your customers want a smooth experience when hiring your services. Whether there are pests that have run amok in their homes and you have been called in to exterminate them, there is a leak in the pipes and your plumbing repair business is the go-to for repairs, you’re in charge of a cleaning business with clients spanning across the residential and commercial niches, or even a locksmith making new installations and providing aftercare for their clients ? it is vital to make the process as hassle-free as possible for your customer. The priority is getting the job done in time, and to quality standards. On the other hand, your mobile workers need access to complete and accurate data to approach the task more proactively, get it done right, and increase the rate of first-time fixes.
When you have multiple clients and a huge workforce, things can get messy with all the paperwork involved. Preparing documents and reports, keying in the data, keeping track of your mobile employees, following up on current jobs and scheduling new appointments ? the workload can put a strain on your staff. Field service scheduling software like FieldElite come in to keep your central office staff abreast with all customer details, sending alerts when new issues arise. These are then relayed to the appropriate technician for the situation to be taken care of at the earliest possible time ? directing the right employee to the customer based on the skill-set availability and location. While field service job management software, by itself, is a powerful solution, you can crank things up a notch by having a system that integrates IoT into its operations.
Powering Field Service Scheduling Software Systems With IoT
FSM gives maintenance firms, distributors, manufacturers and other service businesses an interactive platform that optimises the workflow. From the customers booking maintenance work, office staff tracking operations right from their desk, workers interacting with it while on-ground through the mobile app, to the billing and invoicing ? it is all handled through the same system. IoT applications can boost this becoming a critical tool to show the field managers about the precise locations where attention is needed, for accurate worker and job scheduling and improved customer satisfaction. What if you could also have features like auto-scheduling coming on board? Let’s delve deeper into what it means for your FSM system.
Benefits Of Using Service Management Software With IoT Solutions
Its impact of IoT on field management is seen in the transformation of maintenance data into proactive service actions. Research by Gartner shows that in 2020 there will be over 20 billion connected devices, making the reach of IoT really vast. This will fuel the field management industry, unlocking more potential with the mobile workers interacting in real-time with their equipment and headquarters. This speeds up response time to service requests and transforms interoperability across the different devices.
???????? All-round access
The interaction with IoT benefits the technicians, managers, and customers themselves. For instance, while the worker on ground interacts with the FieldElite mobile app, the office staff at headquarters will be engaging them via browser on their smart devices, and even the client gets access to the system through the customer portal.
???????? Linking your different business operations
It doesn’t stop there. Integrating the mobile service management software to the IoT facilitates inventory management, automobile tracking, and even automates accounting, invoicing, and other internal processes of the business, giving you more visibility over your field assets and operations. Here, the sensors that have been enabled in the network will notify you of damaged equipment, and go further to route and dispatch the technician who is most suited to go on-site and repair it.
???????? Nip things in the bud ? A proactive approach
Updates from sensors on the remote equipment are sent over a dedicated network. This is intelligently interpreted by the IoT platform to decide the next course of action, depending on a predefined set of rules. This course of action can be assigning and dispatching the technician through the FieldElite app to fix the equipment before permanent damage occurs. This whole process is automatic, shifting the company from a reactive mode of operations to a proactive and preventative model, resulting in better utilisation of assets.
???????? Minimise time wastage
Less time is spent going checking for flaws in the systems. Take management at a wastewater treatment plant for instance. Simply place IoT sensors on the different pumps, mortars and valves to give you this data. In case of leaks or damage, the appropriate operator is alerted, taking away the need for manual monitoring. Monitoring is done remotely. Hazardous situations such as in the oil and gas industry where workers are faced with issues like flare stacks are handled better, where the IoT sensors minimise downtime and ensure that only necessary visits to the plat equipment are done.
???????? Interactions at the palm of your hand
The field service workers are also equipped with effective communications through aspects like the chat feature on the mobile app, and reporting abilities where they can make notes, take photos and relay this to the headquarters during the course of the job. Information on the system is readily available to the customer and future technicians who will be handling jobs at the facility.
How does the FSM work with other systems? FieldElite’s core role is to manage the mobile workforce. How do you keep track of the sensors of the different equipment, in order to know when maintenance is needed?
Enter ecoVaro: IoT In Energy Management
The 2018-2025 Global Building Energy Management System Analysis and Forecast showed energy consumption in residential buildings accounts for close to 40% of the world’s energy consumption.? Commercial buildings like shopping malls, hospitals, retail stores and hotels take 30%. IoT tools aid in collecting and analysing the real-time data consumption in these falsities, to improve maintenance and reduce down times. It’s a holistic view that is achieved through a network of smart devices monitoring the ventilation, humidity, air-conditioning and lighting systems.
Home automation tools like smart thermostats and bulbs are already becoming popular. Here, they bring savings to the consumers without them having to use up much effort. For broader energy management, these systems will include units like sensors, controls, meters, data analytics tools, and user-friendly applications that the consumers access all this from. It cuts across the board, from households and commercial establishments, to utility firms and government bodies keen on effectively monitoring and managing their energy resources. Industrial and commercial users need data analytics tools to maximise their productivity and reduce costs, while residents in households want to reduce their monthly bills and take a more proactive role in their energy management.
From Smart Devices To Accurate Loggers
The first step in saving energy is cutting down wastage. Smart light, humidity, temperature and air conditioning controls come in to maintain optimal indoor conditions. Lighting units, smart thermostats, sensor-based HVAC control systems are part of the IoT, taking centre stage in automatically maintaining the perfect indoor environment that will keep the building?s energy use at optimum levels. They have been designed with different sensors that check the humidity, light, motion and even CO2 levels, dynamically adjusting the conditions in the facility. Here, you have situations like smart lights dimming when there is more daylight getting into the room, and then automatically turning off when people leave the room. The smart thermostats can precool the indoor space before the day gets warmer, so that during that scorching midday sun there will be less energy spent by the HVCA to bring down the heat levels.
The whole set up ? from the LED lights adjusting to user preferences and routines, learning thermostats that reduce consumption during peak load times, sensors and data analytics that give the user more control over their consumption, creates a smart energy infrastructure, be it in homes or industrial spaces, from retail stores and factories, to entire cities. This is all geared at cutting down energy costs, with the systems automatically adjusting the building?s lighting, temperature and ventilation, to reduce the energy consumption without compromising the comfort of the building?s occupants. LEED bulbs already record 20% lower maintenance costs than the typical commercial buildings.
Adopting IoT Applications For Your EMS System
How can you take advantage of this? With the EMS loggers, you monitor your facility’s consummation in real-time. Platforms like ecoVaro enable both the utility companies and end-users to access this data. The utility firms will be in a position to tailor the power supply in response to changing demand and also adjust their pricing. The end-users, on the other hand, will be in a position to control their usage at a granular level ? responding to changing environmental conditions, power consumption, and reducing energy waste.
There are also those appliances that come with sensors, from boilers in the household, to heavy production machinery in industries. The EMS systems allow you to continuously monitor the load on the sensor-enabled assets, predict when overheating will occur and pinpoint risks of outages or damage on the line. Maintenance can then be immediately carried out to vent damages to the equipment. That way components like motors are protected from damages that would have ended up costing the firm lots of funds to replace. The data analytics from the EMS platforms enable the energy manager to strike that balance to optimise performance and reduce wear, thus prolonging the life of the equipment.
Even the heavy hitters in the energy sector get to benefit from the IoT. Take power production for instance. When you’re dealing with stations, solar farms and wind fields ? as they provide that much-needed power, they also consume energy and need plenty of maintenance. These are resource-heavy stations and as a manager, you want to keep a close eye on things. This involves a complex approach, from the sensors at the facilities, data analytics, to predictive maintenance. EMS software comes in to continuously monitor the equipment and wiring through the sensors. This enables you to prevent issues like overloads, and ensure that a balanced load is maintained on the line. The EMS goes a step further by enabling you to undertake predictive maintenance, for the timely repair of the equipment on the power grid, minimising accidents, preventing blackouts, and averting the costly down times.
Electricity utilities connecting their power plants and grids to available IoT solution networks get to be more transparent to their consumers, by showing them where the energy they use comes from. This empowers the consumers with the information needed to select the cleanest energy source during that period, which is particularly beneficial for those keen on adopting greener practices. For instance, you can have a system monitoring a network of grids, and dynamically shifting to power sources that have the least amount of emissions at the moment ? what’s gaining popularity as “automated emission reduction”. These lead to utility firms that produce clean energy getting more consumers and growing their revenue base.
Field And Energy Management: How FieldElite and ecoVaro Work Together Through IoT
So, on one hand, you have the energy managers following up on the consumption trends at their facilities, keeping an eye on their equipment.? On the other hand, you have field workers needed to carry out repair and maintenance works at different locations.? How do you join them together to ensure a seamless flow of operations?? The IoT.
This can be seen with ecoVaro and Field Elite interaction. Here, you have two independent systems that are interlinked through the internet and secure cloud systems, bringing more convenience on board for the users.
Picture this: Loggers collecting data from the meters and sensors on-site detect an anomaly, which you will immediately be able to view through the ecoVaro platform. This can be a myriad of issues, from plumbing to electrical systems that need to be worked on, and they are at multiple locations. How do you get them resolved? Dispatch your technicians through FieldElite.
Here’s a snapshot of how this works:
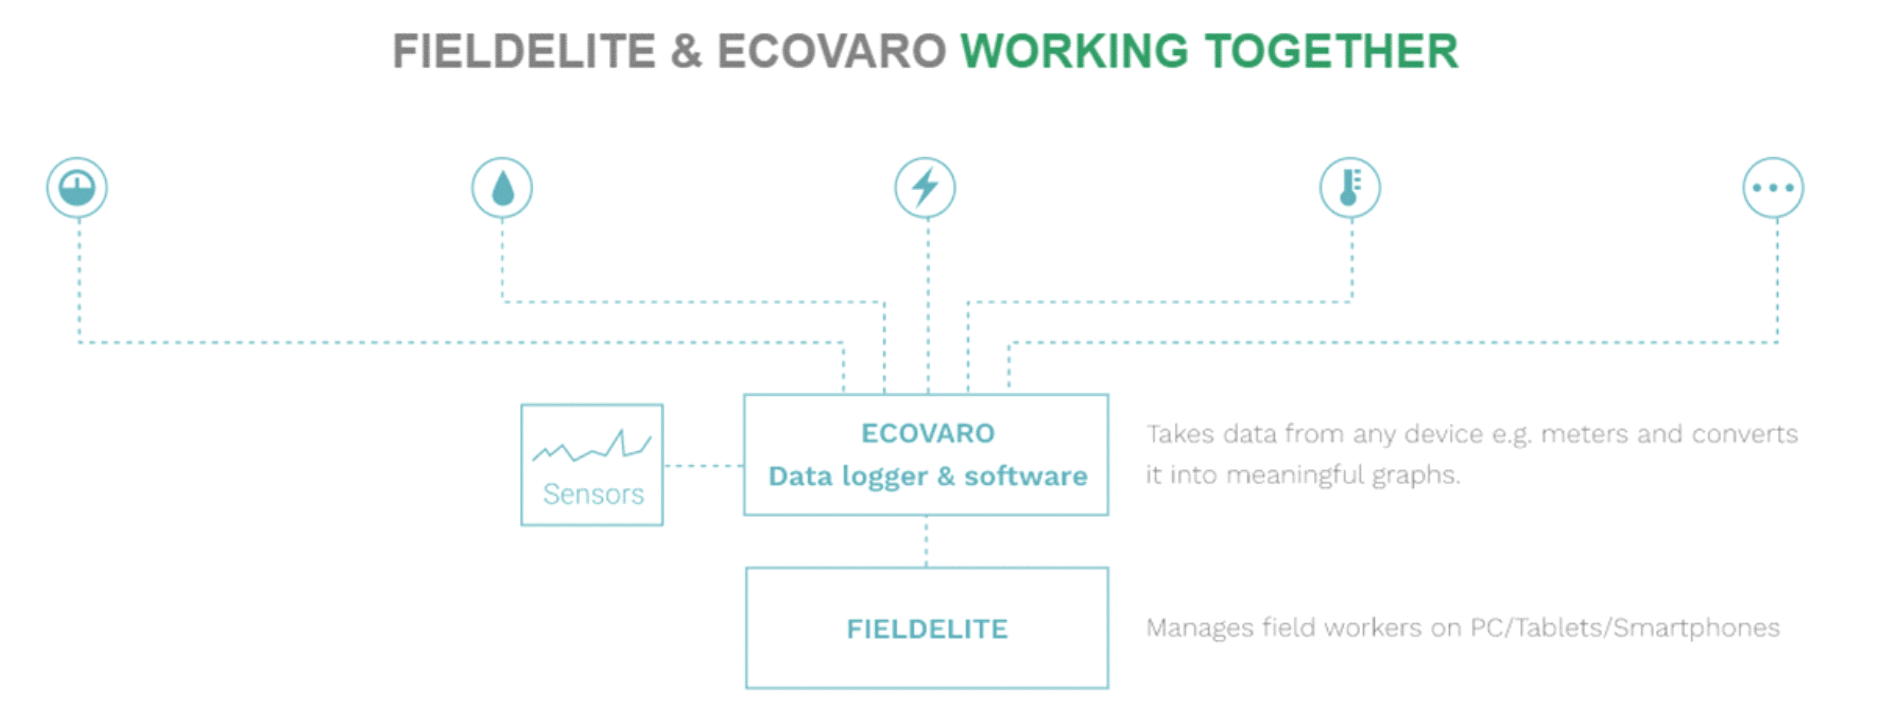
This way, you get to optimise your operations and cut down on coasts ? taking advantage of the data analytics tools brought to you by ecoVaro, and streamlining your workflow through FieldElite. IoT powered workforce and energy management systems thus become key in reducing operational expenses, scheduling repairs and maintenance, and planning for peak hours
Accessing real-time data has the welcome benefit of cutting down on the hours spent on energy management processes. Jobs like meter reading that would have taken lots of time are handled by the system. When it comes to field management, operational efficiency is increased by taking away the manual processes involved with all the paperwork.? The sensors monitored via ecoVaro alert the field service manager about equipment that needs to be checked, and FieldElite shows the field manager issues that are on queue to be resolved. In both cases, you get accurate data that will inform the decisions made ? from the maintenance measures required, to scheduling the jobs for the technicians to handle them. It’s a win-win situation.?
Building Blocks For A Brighter Tomorrow
What’s more, this sets you up for the future. Adopting IoT solutions for your field and energy management operations will score you higher ROIs going forward. The global community is working towards enhancing the efficiency of its operations and putting in place sustainable practices in line with their Social Corporate Responsibility (CSR). This is from service providers like plumbing and electrical repair businesses, to utility firms and power generation plants. Lighting systems, homes, office buildings, factories, communities, transportation and whole cites are getting connected through the internet and more control done via smart devices. This is further accelerated by cloud systems enabling real-time, reliable and secure access to the information. By incorporating these setups into your business structure, you will gain a competitive advantage in your niche. After all, we’re still in the early stages of IoT across the industries.