Managing a mobile workforce comes with its set of challenges. There are multiple coordination levels, administrative hurdles when distributing tasks amongst your employees, the need to meet your customers? expectations, whilst still operating profitably. Your goal is to rake in more revenue, while striking a balance between the number of employees and the quality of the service being rendered. Under utilisation of the company resources may be misinterpreted to mean that you need more employees- which will affect your bottom line. Repeat visits with older jobs affect the response time for new client appointments. Clients get frustrated when their needs are not met on time. Remember that, for your client, their priority is getting their issue sorted- be it that pipe leak, electrical fault, damaged gas valve, or window installation completed on time. Administrative challenges on your end will simply come off as excuses, costing your brand dearly. The different fields share similar challenges- from utility firms, pest control, installation and repair services such as with plumbers and electricians, those running residential and commercial window cleaning companies, to property managers in charge of different buildings. Here are some of the obstacles faced:
1. Coordinating your team
Running things from the office can get hectic when your technicians are out on ground, and clients are at different locations. From appointments being delayed because the workers met traffic on their way, those calling in sick and requiring you to find replacements on short notice, clients who cancel appointments without notice- they all present a logistical nightmare. There is also the need to have a skill-based task distribution in place. Here, the focus is on getting the right technician for the job, not someone who has simply “dealt with it before as they helped their colleagues on a similar job“. With your firm having different personnel, you want to ensure that you spend the most appropriate technician to your client. This also aids the employees themselves, by increasing their morale as they will be dealing with tasks that they are particularly adept at, score you a high first-time fix rate, and avoid having to do follow up visits to resolve issues that were not properly addressed the first time round.
Capterra undertook a field service software survey, which showed that 82% of organisations adopting FSM solutions saw an increased rate of first-time fixes, and a 90% rise in actual conversations from quotes.
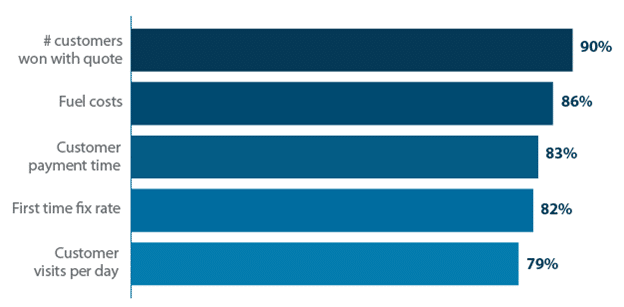
How field service job management software impacts businesses. Source: Capterra
Follow-ups tend to cost extra with the additional dispatch, and take away your fiend agents from the work that had been scheduled to be handled. Resolving these logistical issues with traditional approaches can be problematic, especially with all the paperwork involved. In fact, let’s delve into that.
2. Mounds of paperwork
Having loads of data streaming in from your field workforce can put one on edge. Organising the documents, creating the spreadsheets and typing away at calculators, sorting the files in cabinets and the stress that comes when a single file appears lost in the heaps of sheets – it creates a bottleneck for your operations. Manually handling the data at the central office also compromises on the accuracy of the process due to human error, from syntax issues when transferring information, incorrect inputs, to duplicate errors- which is expected to occur with increased frequency due to the tiring nature of the process. Actually, 46% of the respondents surveyed by the Service Council said that paperwork and admin work was the worst part of their day.
The field worker is also affected by the paperwork. From having to come to the office each morning to collect the documents needed for the day, walking with the bulky files from one site to another, perusing through lots of sheets whenever they want mire information about a particular customer or the job description- and the frustration that comes when some documents have been forgotten back at the office- it hampers productivity. Running out of copies of paper will also be unavoidable when your staff are away from the office- and more time will be spent coming back to restock. There are also additional issues like the forms getting soiled or torn, and even the wind blowing them away as your technicians are out in the field. Dealing with the contracts, collecting signatures for each job that is handled, jotting down notes concerning the particular tasks that they are taking care of- it increases the workload. In fact, this often results in errors in data entry, and jobs being poorly documented.
Fortunately, this doesn’t have to be the case for your firm. Technological advancements have seen solutions being developed to minimise the paperwork involved. These mobile service management software allow the field worker to access all the details of the job via handy apps on their smartphones and tablets- as is the case with FieldElite. Instead of walking around with the documents and files, the information is stored via cloud, and is accessible in real-time. The job documentation- from photos, notes to the customer?s e-signature are all collected through the app, and the information is securely stored and immediately available to the personnel back at the head office.
Service analytics- where you get to observe product demand, performance of your workforce and analyse your customer base growth through the dashboard reporting modules that come with the FMS software is a key tool for decision makers of the company. You get to optimise your performance without having to resort to adding more work hours, or pushing your employees into overtime. Field service analytics has been shown to increase profitability for leading companies by 18%, going by the ?Get Smart: Business Intelligence and Analytics for Service Organizations? study done by Aberdeen Group.
3. Scheduling conflicts
First, there are multiple jobs that need to be attended to- and disappointing your clients will lead to backlash. Secondly, you have a large team of workers- and you want to optimise on their productivity at an individual level. From an administrative perspective, you are also required to provide proper work structures that incorporate your employees? safety during the jobs being handled- and not to run them like mules, overworking them in a bid to hit your targets. Thirdly, the workers have different individual hours of operations- or they work in shifts. Running all this from a central point, allocating the jobs as needed and managing the different schedules, can be a tall order without the right field service scheduling software.
When your customers book an appointment, they expect that your company will deliver on its mandate, providing the services that they are paying you for as required. On the other hand, as the company, you are relying on your employees to meet those expectations. This means that you should have structures in place to ensure that your field workers stick to their assigned schedules. For this you will need to know their location in real-time, track their performance, and check on their adherence to the set schedules. Working with field service job management software allows you to handle the logistics of every task from one dashboard. By tracking your technicians while they are out in the field, you will be able to allocate orders faster, monitor the incoming customer requests, and manage the task distribution more efficiently. When you have an FSM that allows your workers to coordinate with the head office via mobile app, there will be an increased rate of job completion, and a reduction in overtime. Both your clients and employees get to be happy at the end of the day.
4. Lonely workers
Working in the office has its perks. You are surrounded by your colleagues, and can easily get the attention of anyone in management if needed. However, while out in the field, the workers can feel disconnected from the company structure, left to their devices while still bearing the responsibility of presenting the company in positive light- as they also double up as your brand ambassadors. The loneliness can get to them, with a report by the Service Council showing that isolation was the worst part of the work day for 21% of technicians. The chat feature that comes with the mobile service management software apps is one of the reasons behind their popularity, keeping the employees connected to the rest of the manager at the central office, and even other field employees- which makes them feel as part of one large family.
Safety is also a concern, especially for cases where your field staff will be working in hazardous situations – like conducting repairs on top of radio towers, dealing with gas equipment in concealed spaces. The central office needs to remain in constant communication with the workers, and have the appropriate structures in place to handle emergencies. You don’t want to lose employees because they don’t feel that their safety is a priority to you. A skilled technician is an asset that should be protected- and certainly you wouldn’t want to incur extra funds to hire and train personnel- which will end up being an additional strain to your budget over time. Field service job management software with features that allow your employees to check-in remotely via app will be handy in notifying the head office of their arrival at the job site, and in case of any incident, the field manager can quickly see the employees? last location, and dispatch help to them.
5. Difficulty in assessing performance metrics
When you have a situation where timesheets are only handed in after the workday- and in some cases at the end of the week, it becomes difficult to assess the level of productivity of your field workers. Are you getting value for your money with the wages that are being paid out? Are there lots of lost work hours due to logistical hitches- or cases where the field worker delay the tasks, or take out sections of their day to attend to matters of personal interest- and still bill you for it? All this translates to poor customer service, with issues ranging from cancelled and rescheduled appointments, unmet targets, disagreements based on the scope of work being handled, to client dissatisfaction for not having their issues addressed in a timely manner- which becomes a hit on your brand.
FSM comes in to enable the field service manager to always be in the loop during the entire process- knowing exactly how long the workers are spending on each particular task, the jobs that are pending, cancelled or rescheduled, in order to constantly review and optimise the planning of the firm?s activities. With software like FieldElite, you even get a birds-eye view, as the work areas are mapped out, that way you will be in a position to direct your field workers on aspects like the best routes to take to avoid traffic gridlocks.
6. The break factor
How do you plan for breaks? Jobs are different, and there will be unexpected issues cropping up regularly. However, the field worker is still entitled to breaks during the working day- such as the all-important lunchtime. The problem arises when there is unextended time on some job sites, and cases of unscheduled breaks being taken. These have a ripple effect, as they will cause delays on other projects that are on queue, and you can also expect customer complaints to be coming in hot and hard. From a management point of view, you want to have the ability to respond to the issues as they arise, and reassign the jobs accordingly. Mobile service management software gives you this power.
7. Customer relationship management
Customers want to be part of the process, staying in the loop with the service appointments that have been scheduled- and understandably so. From the booking process, to following up on the progress of the job- it all factors in. In case there are issues that crop up- like service vehicles being delayed, situations where extra parts need to be ordered, or the session cancelled and scheduled on a different day- being fully transparent with your customers will be a great boost to your brand. Gaining new clients and retaining the current ones requires the firm to maintain a quality customer service.
Negative feedback because of your customers? feeling neglected will be a setback for your business. Integrating the customer relationship management into the field service will go a long way in enhancing their experience. Here, software solutions like FieldElite have also got you covered with a customer self-serve portal, accessible online through their browsers. This has the welcome benefit of reducing the number of calls as they conduct follow-ups, since they will be in a position to track the project right from the comfort of their homes and office desks, thus increasing customer satisfaction.