

Ticket sales tell a visitor attraction how many people came. They don’t say when those people arrived, where the pressure built up, how they moved between sites, or what kind of day they had. Retailers ask the same questions in their own words: how many people came in, which areas drew them, when were staff stretched, and did the extra footfall actually turn into sales?
Our CrowdSense platform answers the first half of that. It turns Cisco Meraki Wi-Fi, smart cameras and sensors into figures on visitors, occupancy, air quality and access, all in one dashboard. It already runs in libraries, councils and tourism sites, and its camera people counting doesn’t identify anyone.
AI is the next step. Measurement tells you what happened; AI can forecast what’s likely to happen next, flag what looks unusual and suggest what to do about it. Below we cover the metrics CrowdSense records, the predictions you can build on them, a county-wide tourism network in Clare, retail examples from elsewhere, and how to keep all of it on the right side of GDPR.
A note on terms: the measurements below are CrowdSense capabilities today. The AI predictions are things you can build on that data through our analytics work. They aren’t all standard product features, and each one needs testing against real results before you rely on it.
What CrowdSense measures
Each source counts something different. A camera counts people crossing a line. Wi-Fi sees phones and other devices. A survey hears from the people who chose to answer. Mixing them up is the quickest way to end up with figures nobody trusts.
| Metric | Source | What it tells you |
|---|---|---|
| Entries and exits | Meraki MV camera counting lines | When visitors arrive and leave, and through which entrance |
| Live and historical occupancy | Camera occupancy areas | How full a space is now, and how full it usually gets |
| Peak periods | Counts grouped by hour, day or season | When to staff up and when to open |
| Visitors and passers-by | Meraki Wi-Fi location analytics | How many devices nearby actually come in |
| Dwell time | Wi-Fi presence over time | Roughly how long devices stay |
| Return visits | Repeat Wi-Fi observations | Roughly how many devices are first-time or repeat |
| Movement within and between sites | Wi-Fi across connected locations | Common routes and links between attractions |
| Survey answers | Wi-Fi splash-page questions | Country of origin, group type, travel and booking details |
| Environmental conditions | Meraki MT sensors | CO₂, temperature, humidity, PM2.5 and TVOC alongside how busy a space is |
The Wi-Fi figures come from Meraki location analytics. Meraki counts any device it detects as a passer-by, and counts it as a visitor once it has stayed in strong signal range for more than five minutes in a twenty-minute window. The ratio between the two is the “capture rate” (Cisco Meraki documentation). The environmental and camera figures come from the Meraki MT sensors and MV cameras that CrowdSense is built on.
On accuracy, Meraki’s own guidance is that ceiling-mounted fisheye cameras (MV33, MV93) in Advanced people counter mode give the best counts, mounted 2.5–4 metres up in good lighting (Cisco Meraki MV Presence Analytics). In practice, mounting and lighting make a real difference, so check camera counts against a manual count when you set them up.
From measurement to foresight
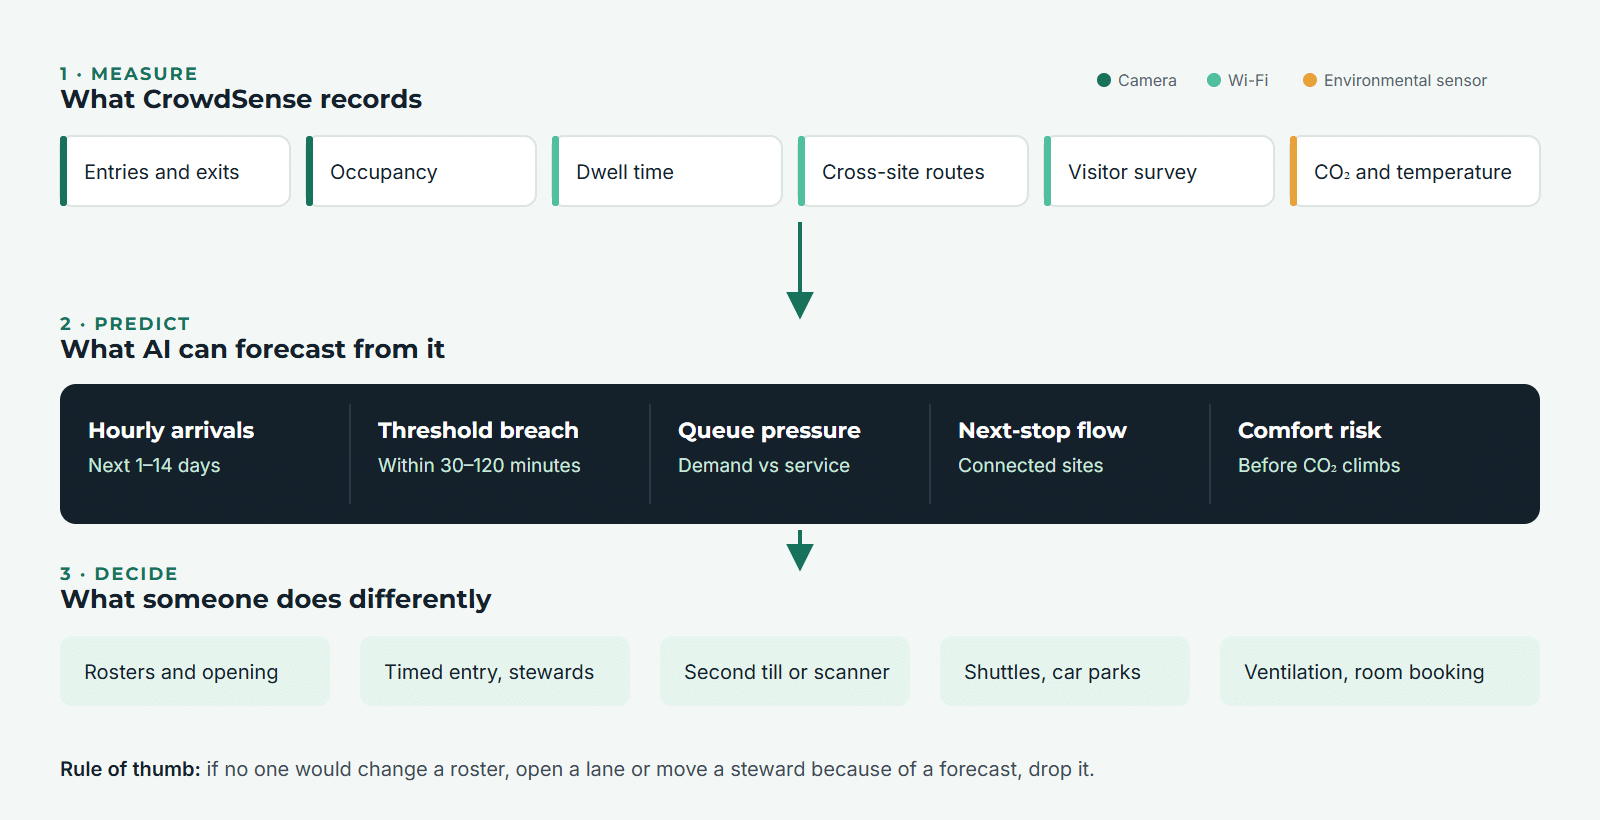
Using AI well here is mostly about restraint: turning trusted counts into a small set of forward-looking measures that someone acts on every day. These are the predictions we recommend, what each one needs, and how to tell whether it’s working.
| Prediction | What it forecasts | Typical inputs | Decision it supports | How to judge it |
|---|---|---|---|---|
| Hourly arrivals | Expected entries per hour for the next 1–14 days | Historical entries, bookings, weather, school holidays, events, cruise or coach schedules | Rosters, opening lanes, shuttle frequency | Average error compared with a simple “same day last year” or “last four weeks” baseline |
| Peak occupancy | Highest expected occupancy and when it will happen | Entry and exit counts, typical dwell, arrivals forecast | Timed entry, stewarding, closing an overflow area | How often the real peak fell inside the forecast range |
| Threshold breach | Chance of passing an agreed occupancy level in the next 30–120 minutes | Live occupancy, arrival rate, recent trend | Early alerts to supervisors | Correct alerts, missed breaches, and how much warning staff got |
| Queue pressure | Whether admission or café demand is outpacing service | Entry rate, zone occupancy, staff on duty, transactions per interval | Open another till or send out a mobile scanner | Whether queues shortened after alerts |
| Dwell-time anomaly | Visits much longer or shorter than usual for that time | Wi-Fi dwell, area occupancy | Check for a congested route, a closure or a wayfinding problem | How many flags staff confirmed as real issues |
| Cross-site flow | Expected activity at the next connected attraction | Movement between sites, travel time, arrivals forecast | Prepare the next attraction, car park or shuttle; cross-promotion | Forecast error at the downstream site |
| Capture rate | Expected share of passers-by who come in | Passer-by and visitor trends, events, signage changes | Testing shopfront, signage or promotions | Change compared with similar control periods |
| Return-visit trend | Movement in the share of repeat visits | Wi-Fi loyalty classes, survey answers | Membership, loyalty and local-resident schemes | Read as a trend only (see “Getting the data right”) |
| Comfort risk | When CO₂ or temperature is likely to pass agreed comfort levels | MT sensor readings, occupancy forecast | Ventilation checks, room scheduling | Whether the forecast came before the reading crossed the level |
| Sales per entry (retail) | Expected transactions and revenue per recorded entry | Camera entries, point-of-sale data, staffing | Staffing, merchandising, stock | Forecast error; investigate gaps rather than assuming a cause |
Building forecasts people trust
- Start simple. Every model has to beat a basic seasonal rule such as “same weekday last year”. If it doesn’t, use the rule.
- Show the uncertainty. “Between 1,800 and 2,300 arrivals, most likely 2,050” is more honest, and more useful, than a single number.
- Be careful with outside factors. Weather, bookings, school and public holidays, events and coach or cruise schedules often improve tourism forecasts, but test each one to see whether it actually helps.
- Label every input. A forecast built on Wi-Fi device counts predicts devices, not people. Calibrate it against camera counts or ticket sales before you call it a visitor forecast.
- Tie each metric to a decision. If nobody would change a roster, open a lane or move a steward because of it, drop it.
- Let AI explain, not invent. A language model can turn the results into a plain-English morning briefing (“Saturday 11:00–13:00 is likely to go over the café threshold; consider a second till”). The numbers themselves should come from checked database queries.
Our data and analytics service covers this whole path, from describing what happened to recommending what to do next. CrowdSense’s exports and API make it possible to join visitor data with bookings, timetables and point-of-sale systems.
County Clare: visitor flows across a whole county
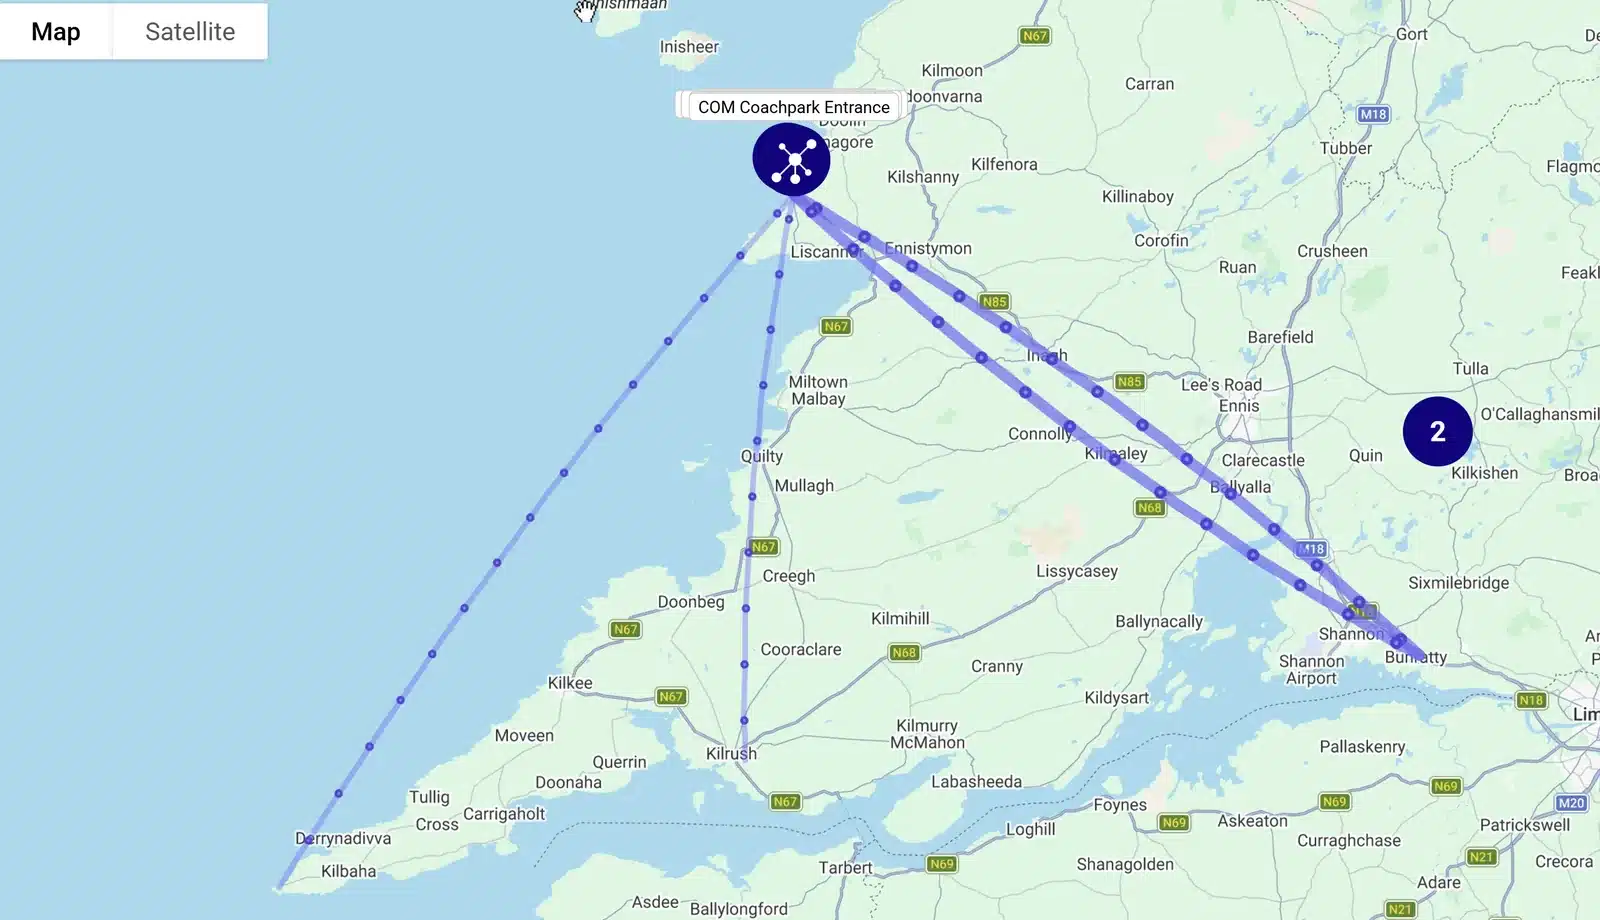
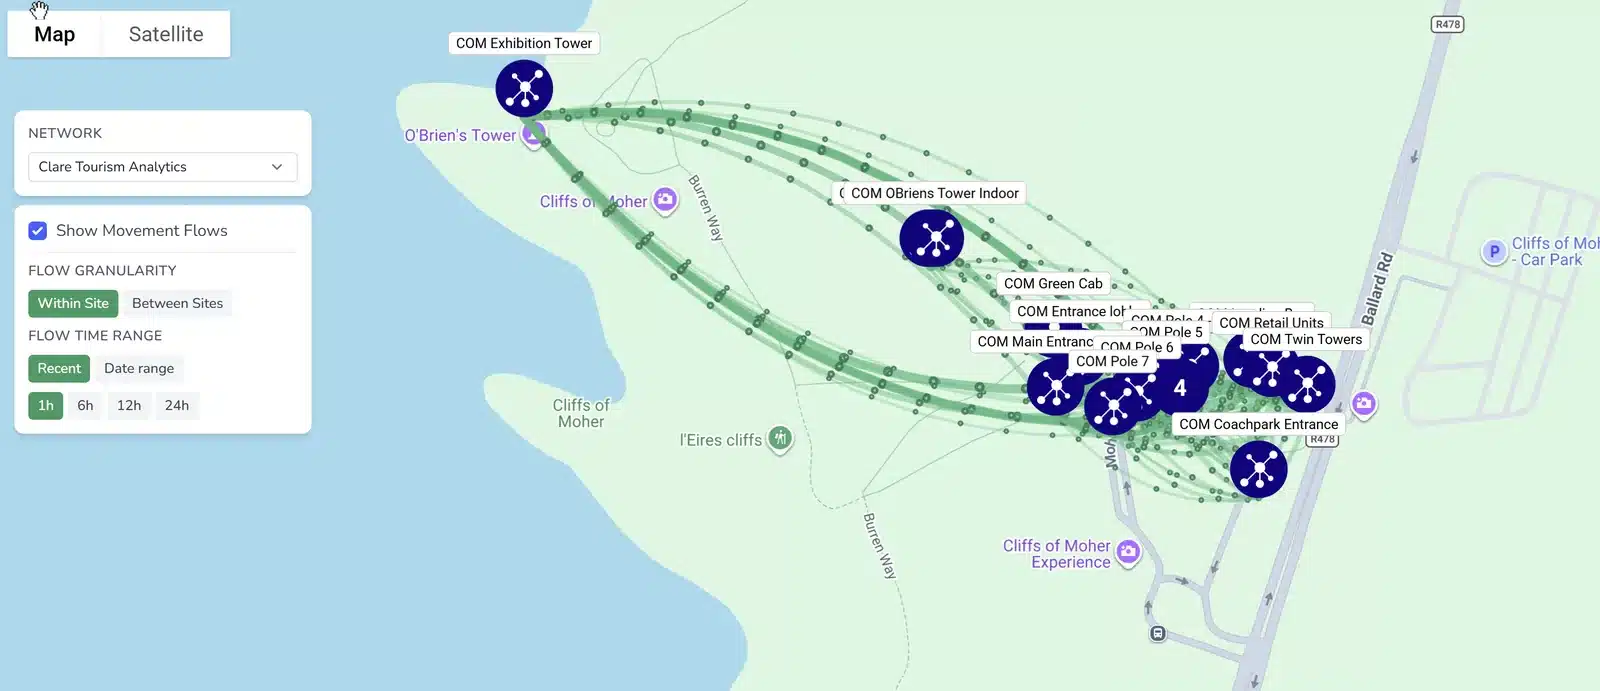
Clare Tourism runs visitor Wi-Fi at the Cliffs of Moher, Bunratty, Loop Head and other Clare sites as one CrowdSense network. Live maps show how visitors move around the Cliffs of Moher, and between attractions across the county.
A tourism survey runs on the Wi-Fi splash page, and visitors register once a week. Their answers on country of origin, group, travel and booking sit alongside the footfall data. This fits Clare County Council’s wider plan, which treats Wi-Fi in tourist centres as central to its tourism strategy and as a way to understand tourist footfall and habits “while fully respecting personal data” (European Commission WiFi4EU interview).
What the flow data shows
- Links between sites: which monitored attractions are visited on the same day, and roughly how long people take to get from one to the next.
- Busy times on the ground: how activity at the Cliffs of Moher builds and eases through the day and the season.
- Who goes where: whether survey groups, such as international visitors, families or self-drive tourists, follow different routes.
- Room to spread visitors out: where quieter sites could take pressure off busier ones.
How AI could take it further
- Forecasting the next stop. If morning arrivals at the Cliffs of Moher reliably come before afternoon activity at Bunratty or Loop Head, a cross-site forecast can tell those sites what to expect.
- Promoting the quieter sites. Grouping common routes helps destination marketers design itineraries and offers for less-visited attractions in the shoulder season.
- Planning the season. Combining the flow history with booking and event calendars supports staffing, shuttle and car-park planning across the county, not just at one site.
- Summarising the survey. AI can summarise how survey answers change each season, as long as it also reports how many people answered and doesn’t treat them as representative of every visitor.
Two cautions. Seeing a device at two sites shows a pattern among phones on the network; it doesn’t prove every visitor made that trip. And our published material on the deployment doesn’t report figures for extra visits or revenue, so treat any forecast from this data as something to test, not a proven return.
What retail has already shown
The line between tourism and retail is thin. Attractions run gift shops and cafés, and town centres depend on visitors. The published Cisco Meraki examples below use the same kinds of camera and Wi-Fi data that CrowdSense brings together. They aren’t CrowdSense deployments; they show what the underlying technology has achieved elsewhere.
SAMSØE SAMSØE: camera analytics linked to sales
The Danish fashion brand connects Meraki MV smart cameras to its point-of-sale system, with retail analytics from Cisco partner EVERYANGLE. When it opened its Munich flagship, the data led the team to rethink who would shop there, which helped deliver a 5.5% higher conversion rate for men’s sales in the first quarter (Cisco case study).
The lesson: comparing footfall with sales shows whether a shop is missing sales it could have made. That’s a fair question for any gift shop at a busy attraction.
Decathlon: camera counts plus guest Wi-Fi
Cisco Meraki partner Analytiks says Decathlon uses Meraki cameras for accurate people counts and guest Wi-Fi for dwell time and visit frequency (Cisco Marketplace). It’s the same pairing CrowdSense uses.
The lesson: use each source for what it does best. Cameras give you the count; Wi-Fi gives you dwell and repeat-visit trends.
Turnstyle: Wi-Fi engagement across 54 restaurants
Over four months and 54 locations, Turnstyle’s Meraki-based platform reported more than 12,000 customer opt-ins, around 18% coupon redemption, a 70% increase in visit frequency and an ROI of more than 15x (CaseStudies.com). These are the vendor’s own figures.
The lesson: splash-page sign-ups and offers can drive repeat visits, but under GDPR, marketing consent has to be separate from simply joining the Wi-Fi.
Queue alerts from MV cameras
Cisco’s UK and Ireland team has shown how a short Python script can read MV zone counts through the API and post a message to store staff in Webex when a checkout queue goes over an agreed length. Staff reply with what they did, which builds up a record of each queue and the response (Cisco UKI blog).
The lesson: the alert matters more than the dashboard. The same setup works for ticket desks, café counters and shuttle stops.
Cisco’s own retail lab
Cisco’s internal retail lab uses MV cameras to count people by zone. It adjusts staffing when checkout lines grow, and tests whether moving merchandise changes dwell time and whether longer dwell turns into sales (Cisco). The Meraki Tech Lab also uses sensors on fitting-room doors and camera-based “hot spot” analysis to guide merchandising and product range (Meraki blog).
What a CrowdSense retail pilot could measure
- Entries per hour against transactions per hour from the point-of-sale system
- Transactions per entry and revenue per entry, labelled as ratios rather than unique-shopper conversion
- Capture rate in front of the shop, before and after a signage change
- Café occupancy against available seats
- An AI flag such as “Entries are well above normal, but transactions aren’t keeping up”, prompting a look at queues, stock or staffing before anyone draws conclusions
Getting the data right
Cameras count a defined area. Counts are only as good as the counting line, camera position and lighting. Check them against a manual count at setup, and again after any change to the layout.
Wi-Fi measures devices, not people. Some people carry more than one device and some carry none. Modern phones also randomise their network identifiers (MAC addresses), which weakens dwell and return-visit figures. Treat Wi-Fi numbers as trends, and calibrate them against camera or ticket counts.
Surveys describe the people who answer. Report how many people responded, and don’t present survey results as a profile of every visitor without cross-checking them.
Privacy and GDPR: designed in, not bolted on
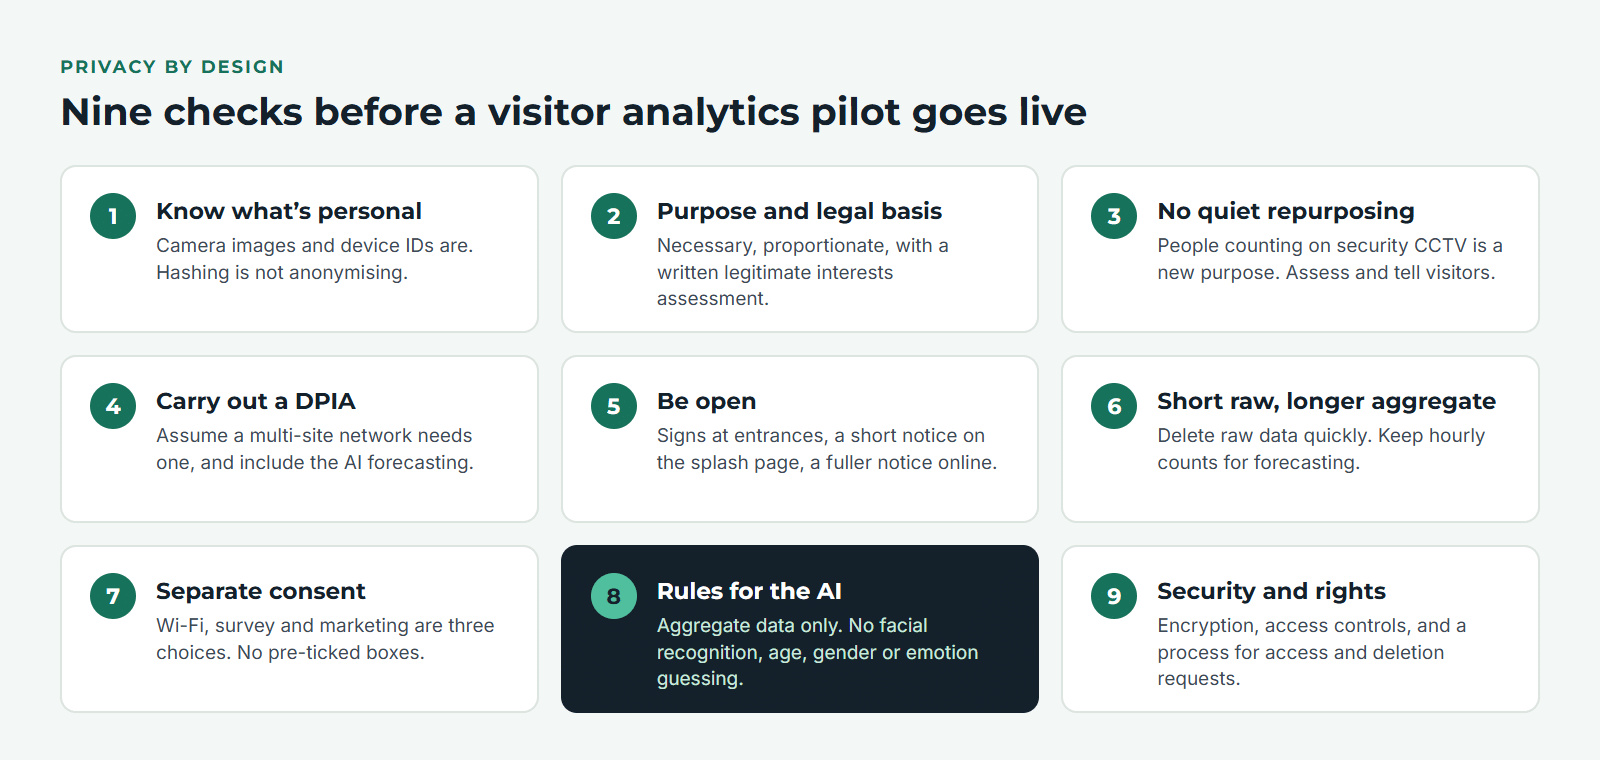
For Irish and EU operators, privacy decides whether a project can go ahead at all. This is the framework we use.
1. Know which data is personal
- Camera images. Footage showing identifiable people is personal data (Data Protection Commission). That holds even if the camera only sends out counts, because it still processes images of people to produce them. Process on the camera, keep only aggregate counts, and record that design decision.
- Wi-Fi device identifiers. MAC addresses and similar identifiers can single out a device, and so its owner. Treat them as personal data. Replacing an identifier with a code (hashing) is pseudonymisation, not anonymisation; the data stays within GDPR unless no one could reasonably re-identify anyone from it.
- Splash-page and survey data. Email addresses, names and library-card logins are clearly personal data, and so are survey answers linked to a login.
- Aggregated outputs. Hourly counts by zone, with small numbers suppressed, are usually low risk. They become higher risk when combined with other data at fine detail.
2. Purpose, legal basis, necessity and proportionality
The DPC’s checklist asks four things: is there a clearly defined purpose, what is the legal basis under Article 6 GDPR, can you show the processing is necessary, and if cameras serve purposes beyond security, are those uses proportionate (Data Protection Commission)? For visitor analytics the usual legal basis is legitimate interests, or public task for public bodies, backed by a written legitimate interests assessment.
3. Don’t quietly repurpose security CCTV
If a CCTV system is used for more than security, the operator must be able to justify that extra use (Data Protection Commission). Adding people counting to existing cameras is a new purpose: assess it, document it and tell visitors.
4. Carry out a DPIA
GDPR Article 35(3)(c) requires a Data Protection Impact Assessment for large-scale systematic monitoring of publicly accessible areas (EDPB Guidelines 3/2019), and the DPC notes that a DPIA may be needed to assess purpose, necessity and proportionality properly. A county-wide or multi-site tourism network should assume it needs one, and the DPIA should cover the AI forecasting as well as the data collection.
5. Be open with visitors
People must be able to find out who the data controller is, how to contact the DPO, the purpose and legal basis, who else receives the data, how long it’s kept and what their rights are (Data Protection Commission). The EDPB recommends clearly visible signs with the key points, plus a fuller notice that’s easy to reach (Datatilsynet summary of EDPB guidelines). For Wi-Fi analytics, that means signs at entrances and a short notice on the splash page.
6. Keep raw data briefly and aggregates longer
Delete footage, ideally automatically, once you no longer need it (Datatilsynet). Set separate retention periods: short for any raw identifiers, longer for the aggregate counts used in forecasting.
7. Keep consent separate
Joining guest Wi-Fi, answering a tourism survey and agreeing to marketing are three different things. Don’t pre-tick boxes, and don’t make Wi-Fi access depend on agreeing to marketing. Electronic marketing in Ireland also falls under the ePrivacy Regulations. It’s telling that Meraki Go turns off its passive visitor insights by default for EU customers because of GDPR (Cisco Meraki Go documentation): privacy-friendly settings should be the default.
8. Rules for the AI itself
- Train forecasts on aggregate counts, never on individual device histories.
- Don’t use facial recognition, or AI that guesses age, gender or emotion, for tourism analytics. It raises the risk sharply and isn’t needed to run a site.
- Keep a person in charge. Forecasts advise staff; they don’t automatically affect individual visitors.
- Record which data each model uses, how long it’s kept and who can see the results.
- Check suppliers: data processing agreements, where data is hosted, and security controls.
9. Security and data-subject rights
Use encryption, access controls and staff training, and be ready to handle requests for access or deletion (Datatilsynet). We publish our privacy, retention and data processing policies for CrowdSense deployments on our public sector page.
This is general guidance, not legal advice. Each deployment should be reviewed by the operator’s data protection officer or adviser.
Start with one decision worth improving
The best pilots start with a single question, for example:
- Can we match admissions staffing to the hourly arrivals forecast?
- Can we warn the next attraction in a county-wide network what’s coming?
- Can we cut long café or ticket queues with live alerts?
- Can we explain why gift-shop sales aren’t keeping up with entries?
- Can we predict when busy rooms will become uncomfortable?
Then follow six steps:
- Name the decision, and the person who owns it.
- Measure a baseline.
- Complete the DPIA and privacy notices.
- Check the counts against manual observation.
- Compare the forecasts with a simple baseline.
- Review the results after a full season.
Transport operators are on the same path; we looked at what has worked for them in AI, cameras and Wi-Fi in transport operations.
How Denizon can help
CrowdSense gives you the foundation: camera counts, Wi-Fi trends, visitor surveys and environmental readings in one place, already running across a whole county in Clare. AI adds the ability to forecast and explain, and careful measurement with privacy designed in keeps both trustworthy. Talk to our team about designing a CrowdSense pilot for your attraction, destination or retail space.