

Walk through any large station and count the sensors. There’s CCTV on every platform, Wi-Fi access points across the concourse, and IoT devices on the escalators, lifts and car park barriers. Most of that kit was bought for a single job, whether security, passenger connectivity or fault alarms, and most of the data it produces is never looked at again.
That’s what has changed. AI can now turn those existing assets into a live picture of what’s happening across a site, without a big new hardware programme. Below we look at where that’s working today, what the UK and Irish trials have actually shown, and how to get started without repeating their mistakes.
Two sensors, two kinds of truth
Cameras and Wi-Fi are often treated as competing ways to count people. In practice they answer different questions, and each covers the other’s blind spots.
| Cameras with computer vision | Wi-Fi presence analytics | |
|---|---|---|
| What it tells you | Precise, event-level detail: a person on the track, a queue forming at the gate line, a vehicle stopped in a yellow box | Anonymised device presence across the whole site: footfall, dwell time and movement between zones |
| Coverage | Only where a camera is pointing | Anywhere within range of an access point, including corridors and concourses |
| Precision | High | Lower: zone level rather than exact position |
| Main limits | Coverage gaps, lighting and privacy rules for images | It sees devices, not people, so counts are estimates |
| Example platform | Smart cameras with on-device analytics | Location analytics such as Cisco Meraki, or similar |
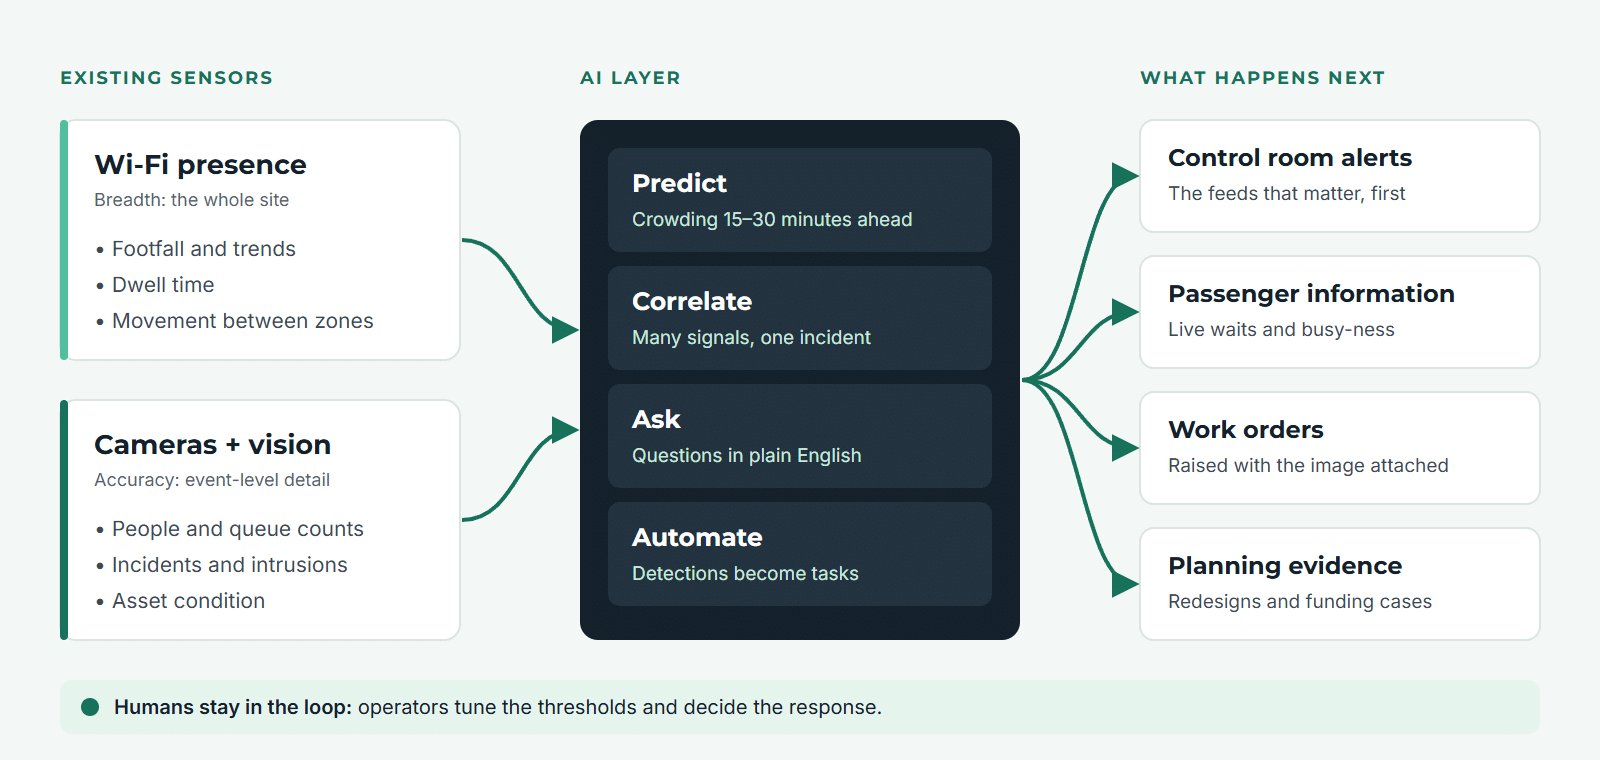
Put them together and you get breadth and accuracy at the same time. Wi-Fi shows the crowd building; the camera confirms what it’s doing when it arrives. AI sits on top of both, joining the signals, predicting what comes next and deciding who needs to know.
Eight places it earns its keep
1. Crowd density and platform safety
Computer vision models count people in defined zones and estimate density in real time. Wi-Fi adds an early warning further upstream: a surge of devices coming through the station entrance usually reaches the platform a few minutes later. That gap is enough time to act.
In practice that means automatic alerts when platform density crosses a safe threshold, prompts to control the gate line, send extra staff or make a PA announcement, and a clear record afterwards for reviewing concerts, matches and disruption days.
2. Queues and waiting times
At ticket offices, security screening, taxi ranks and bus stands, queue length measured by AI and dwell time measured by Wi-Fi together give a waiting-time figure you can trust. You can publish it on passenger information screens and apps, use it to open extra lanes or gates before the queue gets out of hand, and track it over time as a service-level KPI.
3. Passenger flow and journey analytics
Wi-Fi analytics shows how people actually move between entrances, concourses, shops and platforms, including how long it takes to change between rail, bus and tram. That evidence feeds better wayfinding and signage, timetables that line up at interchanges, and station redesign and capacity planning. It replaces manual surveys, which are expensive and only ever give you a snapshot.
4. Incident detection and response
Video analytics can flag the events that matter operationally:
- A person or object on the track, or in a restricted area
- Slips, falls and people lying on the ground
- Unattended luggage
- Wrong-way movement in one-way corridors or on escalators
- Stopped vehicles, debris or wrong-way drivers on roads and in tunnels
None of this replaces the control room operator. What it does is tell them which of several hundred feeds deserves their attention right now.
5. Asset condition and maintenance
Cameras are increasingly used to watch the infrastructure, not just the people: escalators and lifts that have stopped, are overcrowded or are being misused; litter, spills and graffiti; failed lighting, blocked drains and flooding in underpasses.
The real gain comes when those detections go straight into a field-service or CAFM platform. A work order is raised automatically, with the image attached, and routed to the right technician. Add energy and occupancy data, and lighting, HVAC and escalator modes can follow real footfall instead of a fixed timetable.
6. Car parks, EV charging and kerbside
At park-and-ride sites, automatic number plate recognition (ANPR) and space-occupancy detection can push live availability to apps and roadside signs. Cameras can spot non-EVs parked in charging bays and vehicles that overstay, and Wi-Fi footfall alongside charger usage shows how people use a mobility hub. We looked at the business case for that last point in people counting at EV charging hubs.
7. Revenue protection and security
Typical uses are tailgating at fare gates, unusual loitering and anyone on site after hours. When something does happen, the evidence package can be put together automatically instead of someone spending an afternoon scrubbing through footage.
8. Planning, reporting and funding cases
Months of historical analytics become hard evidence: for demand forecasts and changes to service frequency, for accessibility work such as lift demand and step-free routes, for business cases to funders and transport authorities, and for commercial insight on station retail and advertising.
Where AI really makes the difference
Detecting things on camera isn’t new. The step change is in interpreting what the sensors see:
- Prediction. Forecasting crowding 15 to 30 minutes ahead from historical patterns, timetables, weather and event calendars.
- Correlation. Recognising that a Wi-Fi footfall spike, a camera queue alert and a delayed train are one incident, not three.
- Plain-English questions. An operator can ask “Which stations went over peak density last week, and why?” and get a reasoned answer from an AI assistant working over the data.
- Automated workflow. Detections become tickets, notifications and dispatched staff, with no manual handover in between.
What the UK and Irish trials show
There’s now a solid body of evidence from operators on both sides of the Irish Sea. The results are encouraging, and the failures are just as useful.
Transport for London: Wi-Fi data for passenger flow
TfL ran a four-week pilot in late 2016 at 54 Tube stations, collecting more than 509 million depersonalised Wi-Fi data points from 5.6 million devices across around 42 million journeys (TfL). One finding stood out: passengers travelling between King’s Cross St Pancras and Waterloo used at least 18 different routes, something ticketing data alone could never show.
Routine collection began across London Underground stations on 8 July 2019, using pseudonymised MAC addresses (TfL). Within months, analysis of 2.7 billion data points led TfL to adjust journey planner timings for journeys involving 55 stations, including Baker Street, Earl’s Court and Covent Garden (Railway Gazette). Aggregated Wi-Fi data now powers near real-time “busy-ness” information on the TfL website and in the TfL Go app.
The lesson: the Wi-Fi network you already run can replace expensive paper surveys with continuous data, as long as privacy is designed in from the start.
Transport for London: the Willesden Green “Smart Station”
From October 2022 to September 2023, TfL applied AI video analytics to 24 existing CCTV cameras at Willesden Green. The system alerted staff to unauthorised access, safeguarding concerns, passengers needing mobility assistance, people on the track and fare evasion, without using facial recognition (London Assembly).
Over 12 months it generated more than 44,000 triggers, about 55 a day. Staff acknowledged over 60% of them, and only 1% were judged invalid. More than 300 alerts led supervisors to make platform-edge safety announcements (TfL proof-of-concept report).
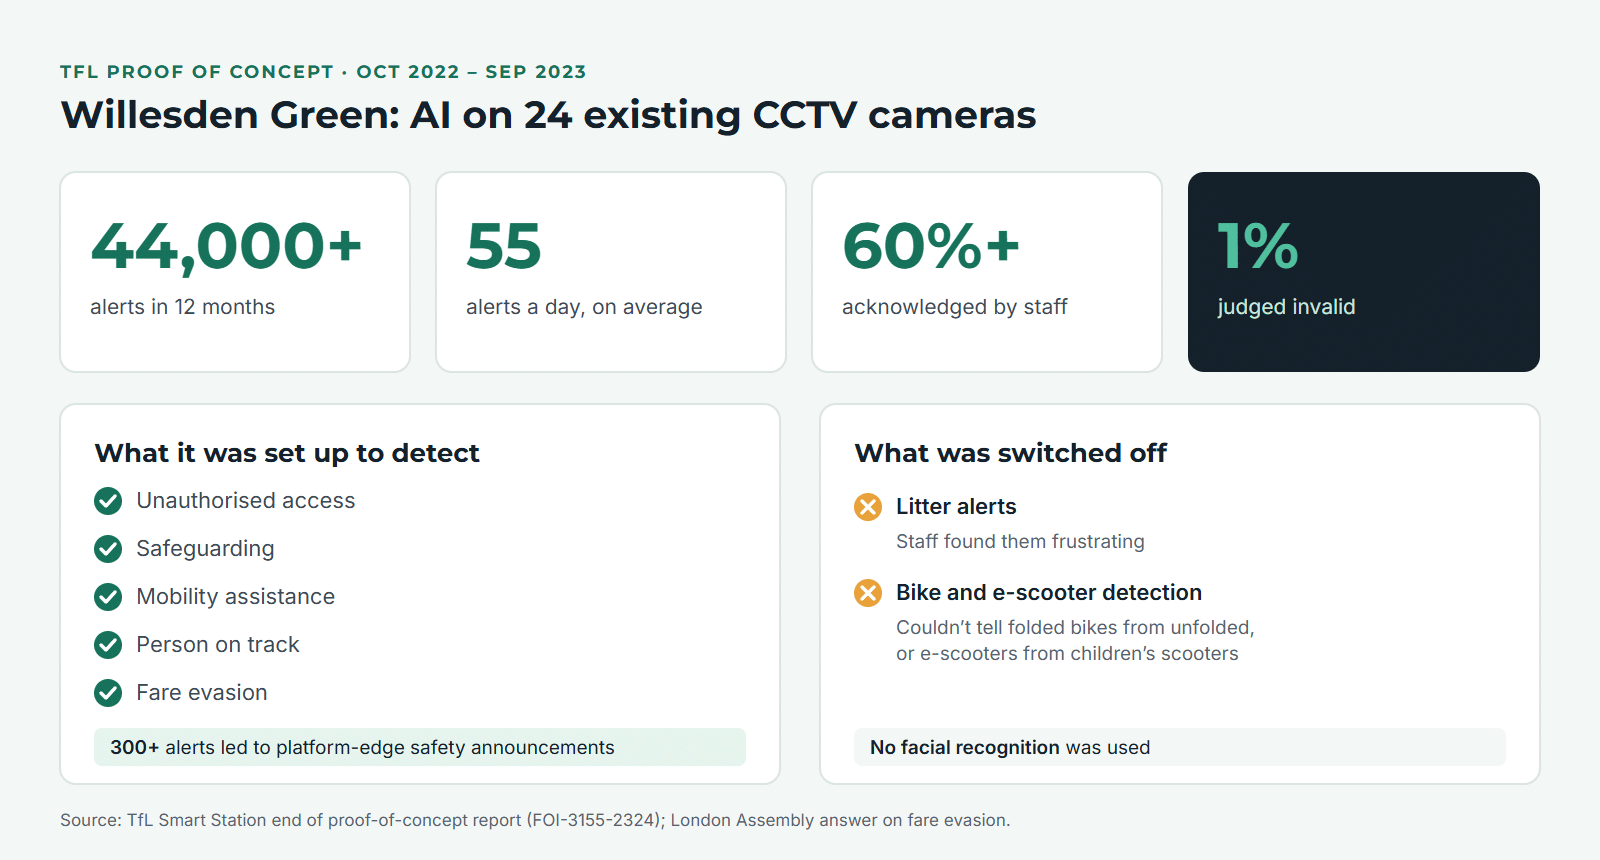
The trial was just as revealing about what doesn’t work. Litter alerts were switched off after staff found them frustrating. Bike and e-scooter detection was disabled because the AI couldn’t tell folded bikes from unfolded ones, or e-scooters from children’s scooters. A second phase focused on fare evasion was delivered with O2 Telefónica and Integration Wizards, with processing on site and automatic face blurring (TfL DPIA).
The lesson: design use cases with frontline staff, and be willing to switch off detections that only create noise.
Network Rail: smart analytics at managed stations
Network Rail trialled AI camera analytics at stations including Euston, Leeds, Glasgow and Reading, using Cisco Meraki smart cameras and Purple Transform’s SiYtE analytics service (Cisco/Network Rail service realisation report). Early false alarms came from passengers reflected in train windows; adding train detection fixed that. Trespass accuracy then reached 98%, with just 3 false positives out of 165 events in one period.
At Reading, video of repeated trespass over a platform wall justified building an anti-climb barrier, and no further incidents were recorded afterwards. Reading also reported a 72% year-on-year drop in bike theft after the cameras went in (The Times). At Leeds, 350 CCTV cameras were connected to the platform to measure people flow, platform crowding and trespass, filtering out track workers by their PPE (WIRED).
The same programme also shows the reputational risk. A short-lived extension that analysed passengers’ emotions and demographics drew strong criticism from privacy campaigners once it became public (The Times).
The lesson: focused safety use cases deliver measurable results, but drifting into sensitive analytics can quickly undermine public trust.
Network Rail and LNER: AI on forward-facing train cameras
Network Rail, LNER, CrossTech and Hitachi Rail ran a 12-month trial with a forward-facing camera in the cab of an LNER Azuma on the East Coast Main Line. CrossTech’s computer vision picked out leaves on the line, overhanging trees, invasive species, obscured signal sightlines and embankment subsidence (Hitachi Rail). Unlike the earlier Hubble system, which recorded video for upload later, the trial aimed at live monitoring (Railway Technology).
The lesson: a camera on a service train turns every journey into an asset inspection.
Iarnród Éireann: analytics on a national CCTV estate
Irish Rail uses an Avigilon CCTV system for station security, with alarm analytics, licence plate recording at level crossings, trackside security and bridge strike monitoring. The analytics detect intrusion into secure areas, objects entering or leaving areas, and loitering (Iarnród Éireann FOI response). Its 2025 framework for IP HD and PTZ cameras will connect stations nationwide to its fibre network and a remote control centre (public procurement record).
CIÉ Group: AI video redaction
CIÉ, the parent of Irish Rail, Bus Éireann and Dublin Bus, introduced Facit’s Identity Cloak in 2023 to mask faces and number plates automatically in footage released for data access requests. Processing time fell from around four hours to around 30 minutes per video, a reduction of about 90% (Facit).
The lesson: AI can cut the compliance cost of running a large CCTV estate, not just add new detections.
Transport Infrastructure Ireland: tunnel incident detection
TII operates a video automatic incident detection (VAID) system that creates video clips when an incident happens inside a tunnel and alerts operators to review them (TII data protection notice).
The wider Irish picture
The National Transport Authority’s passenger security report records thousands of cameras across Irish networks, including 2,424 on Dublin Bus vehicles, and recommends expanding real-time monitored CCTV on rail and Luas (NTA). That installed base is a strong starting point for AI analytics, just as it was at Willesden Green and Leeds.
Privacy and governance
Stations are public spaces, and trust is hard to win back once it’s lost. A responsible deployment should:
- Use anonymised or hashed device identifiers for Wi-Fi analytics, and avoid storing personal data.
- Process video on the camera wherever possible, so only metadata such as counts and events leaves the device.
- Avoid facial recognition unless there’s a clear legal basis; it is heavily restricted under GDPR and the EU AI Act.
- Complete a Data Protection Impact Assessment (DPIA) before go-live.
- Put up clear signage and publish privacy notices.
- Set retention periods and access controls for video and analytics data.
How to get started
- Start with the problem, not the technology. Pick two or three operational pain points, such as platform crowding or slow fault reporting.
- Audit what you already have. Most sites already have IP cameras and enterprise Wi-Fi that can run analytics.
- Pilot at one site. Agree the KPIs up front: response time, queue time, incidents detected and work orders raised automatically.
- Integrate early. The value comes from connecting analytics to control room systems, passenger information and maintenance workflows.
- Keep people in the loop. Tune alert thresholds with operators so they don’t end up ignoring alarms.
- Scale on a common platform. A shared data layer and dashboards mean each new site and use case adds to what you already have.
Common pitfalls
- Deploying analytics without anyone who owns the alerts and acts on them.
- Too many false positives early on, so staff stop trusting the system.
- Dashboards that sit in a silo and never reach the people running the station.
- Underestimating the network bandwidth and storage that video needs.
- Leaving the privacy review until the end.
The infrastructure is already there
AI, camera and Wi-Fi analytics are no longer experimental in transport. Used together, they give operators a live, evidence-based view of crowds, assets and incidents, and a direct path from spotting a problem to dealing with it. The operators getting the best results start small, focus on clear operational outcomes, plug into the workflows they already run and build privacy in from day one. Most of the hardware is already on the wall. The opportunity is in making it useful.
How Denizon can help
Our CrowdSense platform brings people counting, visitor trends and environmental sensors into one dashboard, built on Cisco Meraki Wi-Fi and smart cameras, with exports and an API for joining the data to other systems. FieldElite turns detections into scheduled work orders for your maintenance teams, and our data and analytics team can join the two with timetable and incident data. If you want to test what your existing cameras and Wi-Fi could do at one site, talk to our team about a pilot.