

Charge-point operators have no shortage of data. Every session produces kWh, duration and revenue, and the charge-point management system rolls that up into utilisation by port and by hour. Those numbers tell you how well a site performs. They don’t tell you why — and they only arrive after the capital is spent.
We built an ROI model for people counting at public DC charging hubs in Ireland to see where foot-traffic data actually pays its way. The answer surprised us: the money isn’t in selling data at the charger. It’s in choosing better sites.
Plug data shows the result, not the demand behind it
Time-based utilisation is the main revenue driver, and benchmarks are sobering. US DC fast charging averaged 16.4% in Q4 2025 (Paren); UK chargers of 150 kW and above averaged 12.8% over the same quarter (TransportXtra); and typical German fast-charging stations run at 10–15% daily occupancy, with the best at 20–25% (EVS38).
That gap between average and best is the opportunity. But a CPO choosing between two candidate car parks has no plug data for either. Utilisation, sessions and kWh are all lagging indicators: you only get them once the chargers are in the ground.
What foot traffic adds
Foot-traffic analytics measure the demand around a site, before and after the charger exists:
- Footfall is a demand proxy for sites you haven’t built yet. Sites with no nearby amenities averaged 3 sessions a day, sites with some amenities 9, and sites with 11 or more amenities 28 (NACS Magazine, citing Paren).
- Dwell time tells you whether charger power matches how long people stay. Median charge times were 28–36 minutes across more than 4,000 sessions, and drivers who walked to shops stayed about 10 minutes longer than those who waited in their cars (World Electric Vehicle Journal).
- Conversion to nearby shops is the figure a retail partner will pay for: 53% of drivers visit an on-site facility and 47% walk to nearby businesses (MobilityPlaza, citing Oliver Wyman).
- Spend uplift supports better host and lease terms. A study of more than 4,000 California stations and 140,000 businesses found spending rose 2.7–3.2% at businesses within 100 m of a charger (MIT).
The diagram at the top of this article shows a typical layout: a thermal sensor under the canopy measures dwell and whether drivers stay in the car, while 3D sensors on the walkway and the shop door count footfall and shop entries.
Join the two and you get four new KPIs
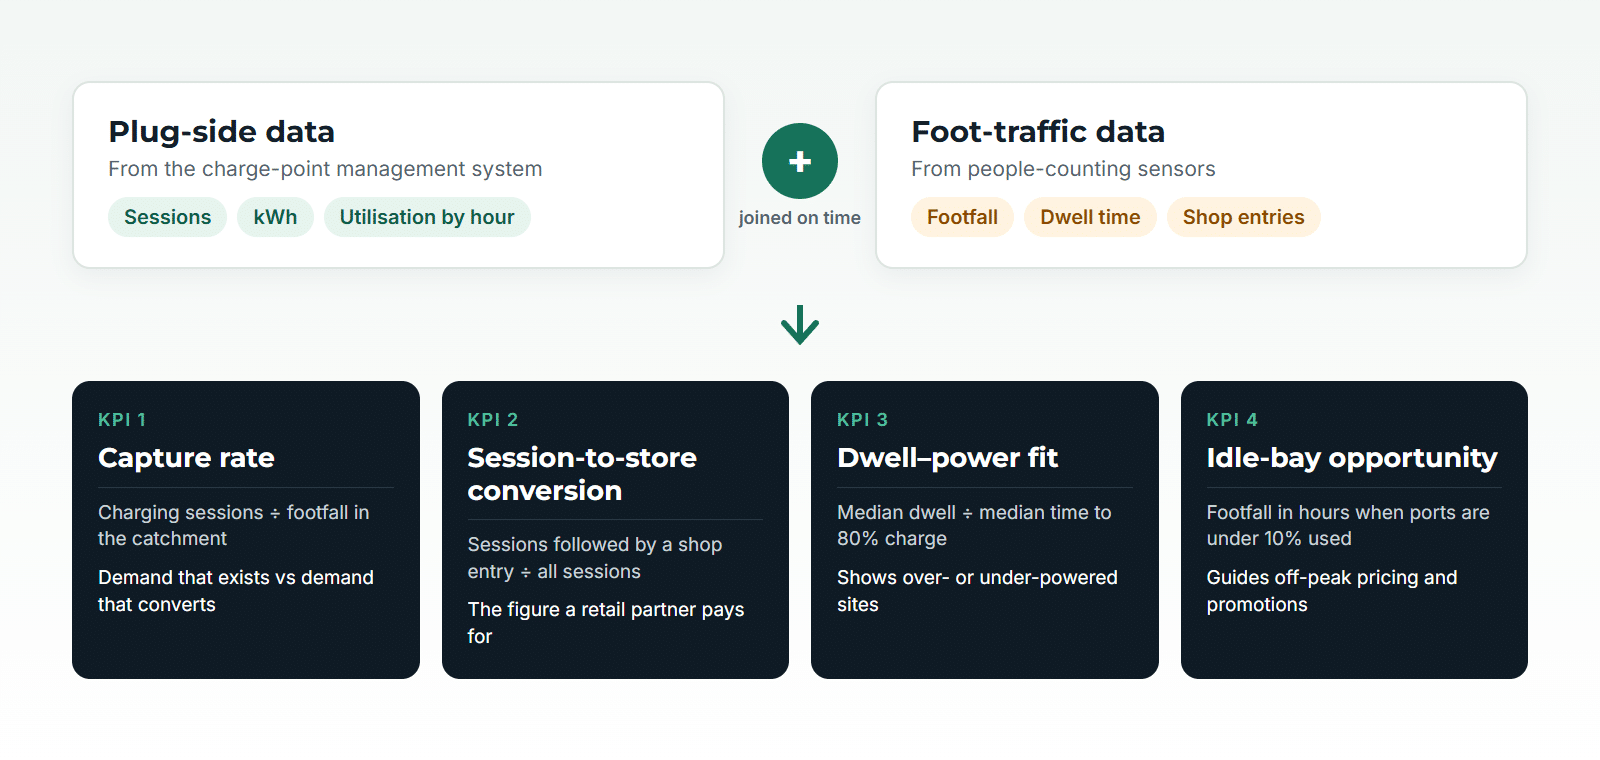
The value comes from joining plug data and foot traffic on timestamp, not from choosing between them. Together they produce four measures that neither dataset gives on its own:
- Capture rate: charging sessions divided by footfall in the catchment. This is the gap between demand that exists and demand that converts, and the main input to site selection.
- Session-to-store conversion: sessions followed by a shop entry, divided by all sessions. This is the billable figure for retail partners.
- Dwell–power fit: median dwell divided by the median time to an 80% charge. Well above 1 means the site is over-powered; below 1 means drivers have to leave the shop early to move the car. As one operator puts it, placing 150 kW chargers where people stay three hours is “technically and economically inefficient” (Powy).
- Idle-bay opportunity: footfall during hours when ports are less than 10% used, which guides off-peak pricing and co-promotions with retailers.
Where the return really comes from
Our reference site is a typical Irish hub: four 150 kW DC ports at a retail park or supermarket, 12% utilisation, an average 50 kW delivered while in use, and ESB ecars’ pay-as-you-go tariff of €0.72/kWh (ESB; Irish public DC prices range from €0.50 to €0.87/kWh, Irish EV Association). That gives roughly 210 MWh and €60,000 of gross margin a year — so each extra percentage point of utilisation is worth about €5,000.
Against that, we modelled the benefits of instrumenting a site. Retail partnerships (a per-visit fee, sponsorship and better host terms) and operational gains (idle fees, power matching, maintenance timing) are real but small. On their own, they roughly pay for the sensors: a single existing site with 3D sensors comes out at about +€1,200 over five years in the base case, and −€17,500 in the conservative case.
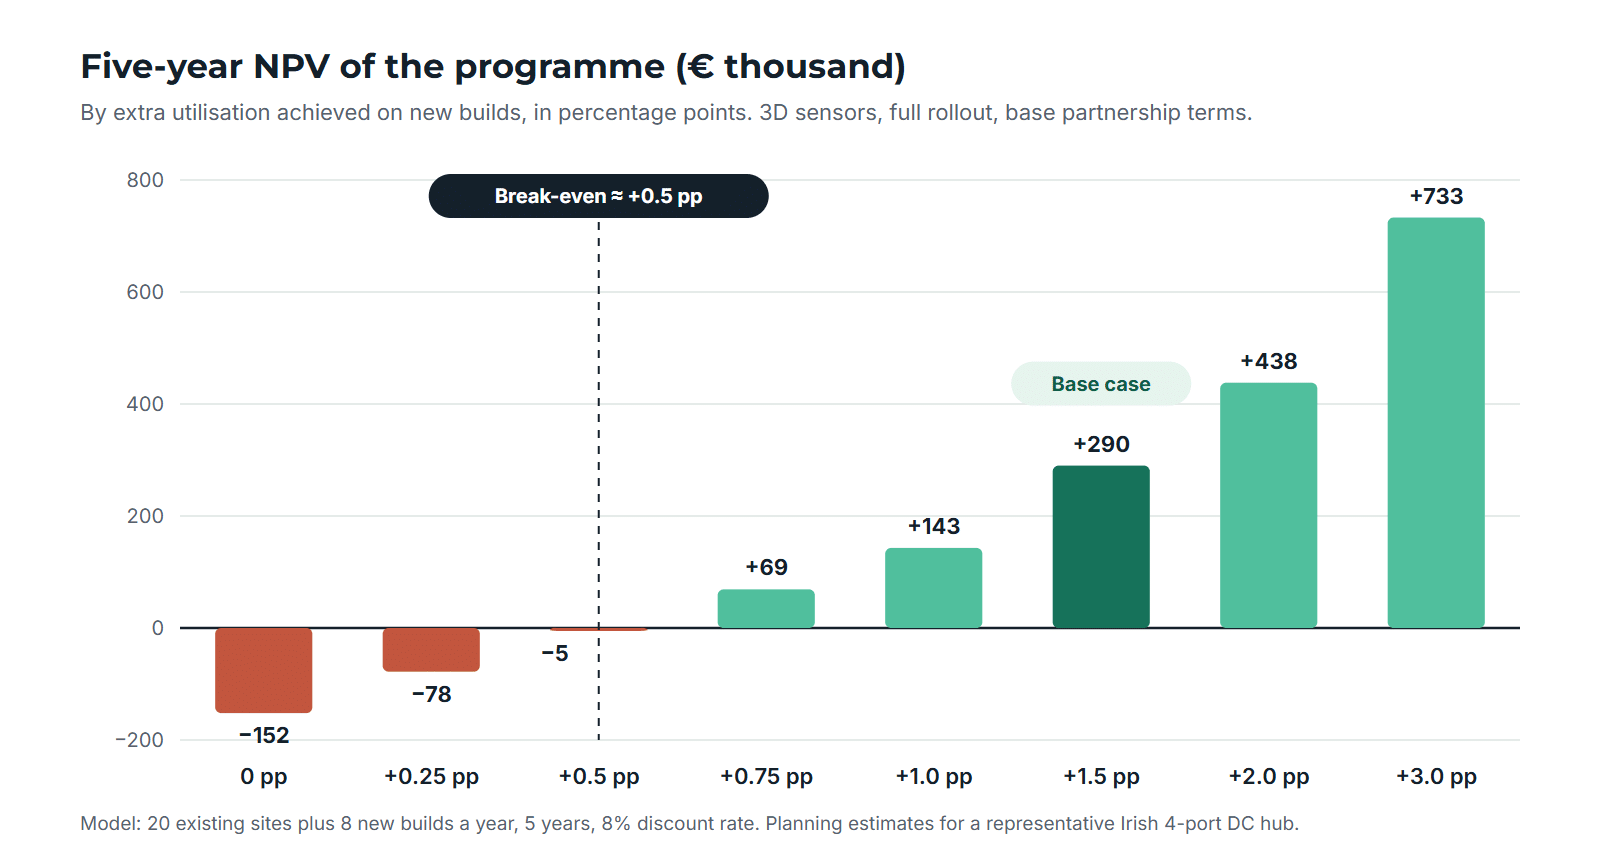
The business case depends on using footfall to pick better new sites. Across a portfolio of 20 existing sites plus 8 new builds a year, the programme breaks even if analytics-led site selection lifts utilisation on new builds by about half a percentage point — choosing sites that average 12.5% rather than 12%. At +1.5 points (our base case) it returns a five-year NPV of about €290,000, a payback of 3.3 years and an IRR of about 29%.
There is also upside the model leaves out. Avoiding one stranded site — a hub that never reaches viable utilisation — saves more capital than the whole analytics programme costs. One avoided bad site in five years would roughly double the base-case NPV.
Choosing sensors
Three technologies are realistic for outdoor charging sites. They differ less on price than on what you can do with the data:
| 3D stereo / time-of-flight | Thermal | Wi-Fi / Bluetooth tracking | |
|---|---|---|---|
| Unit price | $800–$2,000 per sensor (Surveillant); outdoor models up to $1,650 (StoreTraffic) | $500–$1,500 per sensor (Surveillant) | Low; often a software add-on to existing access points |
| Count accuracy | Highest, handles groups (98%+) | Good, robust in darkness (about 85% in one comparison) | Naive device counting overestimates unique visitors 3.7–6.2 times (MyWiFiNetworks) |
| Dwell and journey (bay to shop) | Yes, with handover between sensors | Limited, zone counts only | Unreliable: phones randomise their identifiers (Ariadne) |
| Privacy | Depends on edge processing; image capture means CCTV rules apply | Strong: no identifiable image | Weak: device addresses are personal data even when randomised |
| Best use | Shop entrances and walkway “gates” | Canopy zones, toilets, night counting | A cheap trend indicator, never for billing |
In our model, a permanently instrumented site costs about €9,800 with 3D sensors, €8,200 with thermal and €2,250 with Wi-Fi, plus €810–€2,720 a year to run. Wi-Fi looks attractive on IRR only because its capital cost is small; its absolute NPV is the lowest, and a retailer is unlikely to accept device-based attribution for per-visit billing.
Practical notes for Irish sites
- Specify IP66/IK10 enclosures rated to −20 °C, with anti-condensation heaters for canopy-mounted sensors.
- Put surge protection on every PoE run between canopy and cabinet: charging sites have long outdoor cable runs next to high-current DC cabling.
- Keep sensors on their own VLAN or an LTE/5G router, sending data out over MQTT or HTTPS. Never share a flat network with the chargers’ OCPP traffic.
- Low sun and wet tarmac can affect thermal contrast, so validate every site against a manual count during commissioning.
Privacy and the AI Act
The Data Protection Commission treats identifiable CCTV images as personal data, and footage stays personal data if anyone could be re-identified (DPC guidance). Specify sensors that process on the device, so only counts and anonymous trajectories leave it; carry out a DPIA and legitimate-interest assessment; put up signage; and keep retention short.
Don’t build a business case on demographics from cameras. Estimating age or gender from images for audience analytics is high-risk biometric categorisation under Annex III of the EU AI Act (AI Act Service Desk), with obligations applying from 2 December 2027 after the Digital Omnibus (European Commission). For audience profiles, use CSO small-area census data and aggregated, opt-in app or loyalty data instead.
Start with a calibration panel, not a full rollout
You don’t need sensors everywhere. You need enough permanent sites to learn how footfall translates into utilisation, plus portable survey kits to measure candidate sites before you build. Our recommended configuration is permanent sensors at 8 representative sites (urban, retail park and motorway), at about a quarter of new builds (the retail-anchored ones), and 3 portable kits for every candidate site.
| 3D sensors | Full rollout | Calibration panel |
|---|---|---|
| Year-0 outlay | €244,500 | €126,900 |
| 5-year NPV, base case | +€290,000 | +€327,000 |
| Payback, base case | 3.3 years | 2.7 years |
| 5-year NPV, conservative case | −€764,000 | −€214,000 |
The panel keeps or improves the base-case value while cutting the downside to under a third. A sensible roadmap is six to eight weeks of design and DPIA; a six-month pilot that validates accuracy against manual counts (to within ±5%) and signs two retailer pilots; then surveying 10–15 candidate sites to test whether the model ranks existing sites correctly.
Six recommendations
- Fund a calibration panel, not a full rollout: 3D/ToF sensors at shop entrances, thermal or ToF at the bays, and portable survey kits.
- Make +0.5 percentage points on new builds the hurdle. Stop or rescope if the back-test can’t show that predictive power by month 9.
- Price retailer partnerships on verified conversions — per visit or revenue share, not flat data fees.
- Keep Wi-Fi tracking out of billing and site selection. Use it, at most, as an aggregate trend signal where an access point already exists.
- Keep audience profiling non-biometric to stay clear of Annex III from December 2027.
- Use dwell data to fix power-to-site mismatches: high-power chargers at short-dwell forecourts, 50 kW DC or AC at long-dwell supermarkets and malls. It is the quickest win and needs no partner.
How Denizon can help
Our CrowdSense platform already brings people counting, visitor trends and environmental sensors into one dashboard for libraries, councils and tourism sites, with exports and an API for joining the data to other systems. If you run or are planning charging sites and want to test footfall-led site selection, talk to our team about designing a pilot.
About the model
Costs and uplifts are planning estimates for a representative Irish 4-port DC hub: an 8% discount rate, a 5-year life with no residual hardware value, partnership revenue at 50% in year 1, and site-selection uplift from the year after commissioning. Prices for sensors are list ranges from the sources linked; swap in your own utilisation history, sensor quotes and host lease terms before making a commitment.